What's new in JProfiler 4.3
Change release:
Please see the change log for a detailed list of changes.
JProfiler 4.3 introduces the following notable new features:
With the profiling platform you can write your own custom profiler for special situations.
You can profile remote JVMs or load snapshots and analyze them programmatically with the profiling platform. In addition,
you can also run a custom profiler in the same process - applications of this scenario include advanced monitoring facilities.
The platform is contained in $JPROFILER_HOME/bin/platform.jar, documentation can be found in $JPROFILER_HOME/api/javadoc.
The API is written for Java 1.5+, a backport for Java 1.2-1.4 is available in platform_java_14.jar.
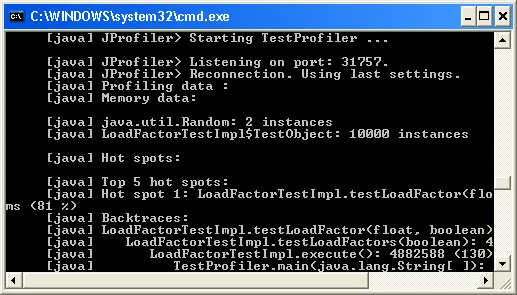
The above screenshot shows the output of the ready-to-run sample with an ant build file that is available in
$JPROFILER_HOME/api/samples/platform.
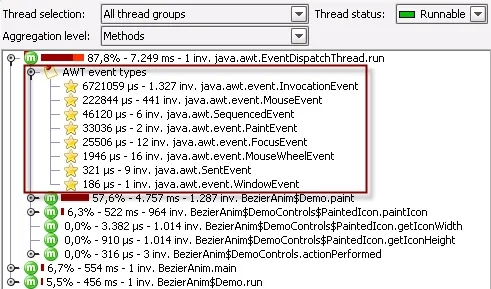
The interceptor API allows you to inject code at entry and exit of arbitrary methods, giving you
access to method arguments and return values. With the measurement, you can create "payload" objects and add them to the call tree.
Each interceptor creates its own hot spot type. This API allows you to add functionality to JProfiler similar to the built-in JDBC, JMS and JNDI
service call measurements. $JPROFILER_HOME/api/samples/platform contains a sample for such an interceptor that creates statistics on
AWTEvent types handled by the AWT event queue. The screenshot below shows payload data in the call tree from that interceptor:
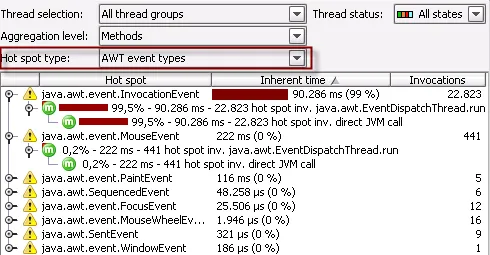
The hot spot type contributed by an interceptor allows you to analyze payload from all call stacks grouped by the payload description:
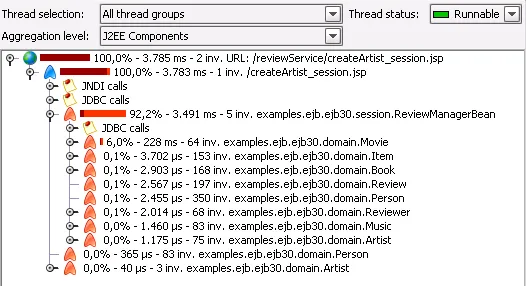
EJB 3 support. In addition to the existing EJB 2 support, JProfiler can now detect EJBs that are written against the EJB 3 specification.
The screenshot below shows the call tree in the J2EE component aggregation level with an EJB 3 example application.
The class tracker enables you to observe how instance counts for selected classes or packages develop over time. This expands on
the existing differencing columns in other memory views. It is a highly useful tool for
observing the development of classes whose instance counts are critically high or continuously rising due to a possible memory leak.
The selection of the tracked classes as well as the liveness and object type options are persistent for each session.
Integrations for the newest releases of popular IDEs:
- IDEA 6.0. The integration has been available on the plugin server since the EAP and is now bundled with this JProfiler release. The IDEA integration now supports changing the used JProfiler executable in the IDEA GUI.
- Netbeans 5.5. The Netbeans integration now gives access to the snapshot comparisons feature and supports profiling non-bundled Sun Java System Application servers. Several bugs in the integration were fixed.
- eclipse 3.3. For early adopters, JProfiler tries to support milestones in a timely fashion. This release supports eclipse 3.3 M3. eclipse 3.3 introduces support for multiple profilers (search for "Launch tooling" in the Preferences dialog).
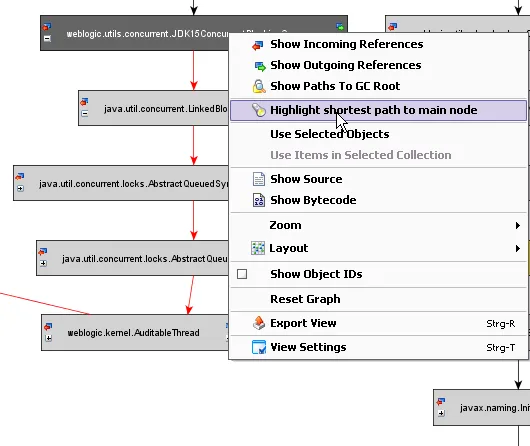
An action to highlight the shortest path to the main node in the reference graph of the heap walker. This action highlights the best path
in red which allows you to quickly find your way from any node to the main object that the reference graph is currently displaying.
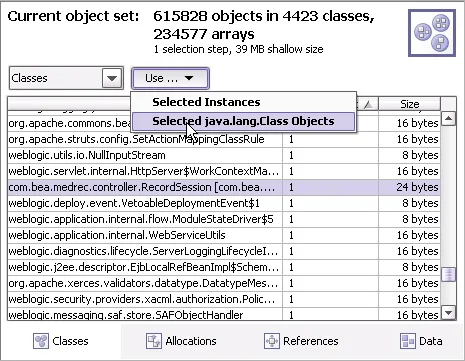
An action to select java.lang.Class objects in the Classes view of the heap walker. This action is especially useful if you suspect a
classloader-related memory leak. With the resulting class objects, you can directly go to the reference graph and search for a path to a
garbage collector root to check why a class has not been garbage collected.
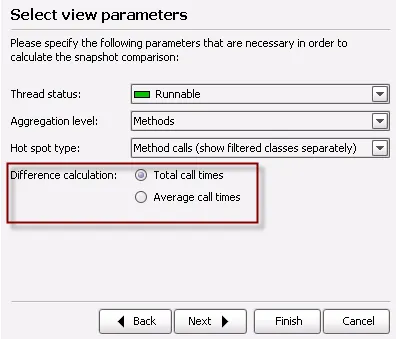
Optionally calculate snapshot CPU comparisons with average call times. This new option uses total times divided by invocation counts and
is available for the CPU call tree comparison as well as the CPU hot spot comparison.
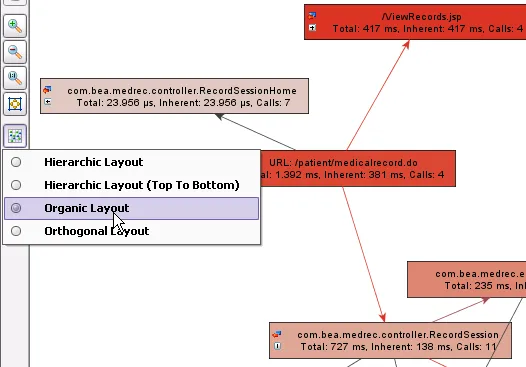
Layouters in the Call Graph view. Previously only the hierarchic layouter was available in the call graph. The new choice of layouters
allows you to present the call graph in other, possible more informative visualizations.