- AIX 5.2/5.3 on PPC
- HP-UX 11i on PA_RISC
- Mac OS X on Intel
What's new in JProfiler 4.2
Change release:
Please see the change log for a detailed list of changes.
JProfiler 4.2 introduces the following notable new features:
Support for additional platforms.
JProfiler can now profile on the following platforms (32bit and 64bit VMs):
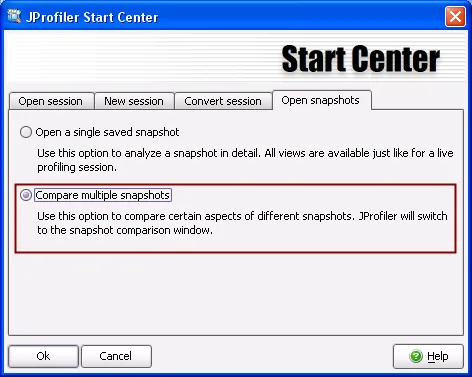
A snapshot comparison facility
has been added. Snapshots are compared in a
separate top-level window that is accessible from the main menu or from the start center
as shown below.
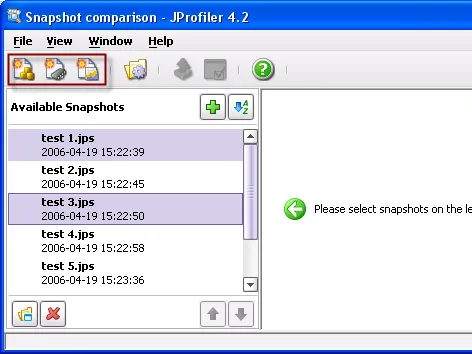
You can create comparisons by adding snapshots to the snapshot selector on the left side of
the comparison window, selecting the snapshots that should be compared and invoking one
of the comparison wizards from the toolbar. There are separate wizards for CPU, memory and VM telemetry
comparisons.
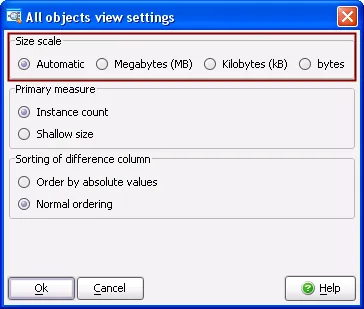
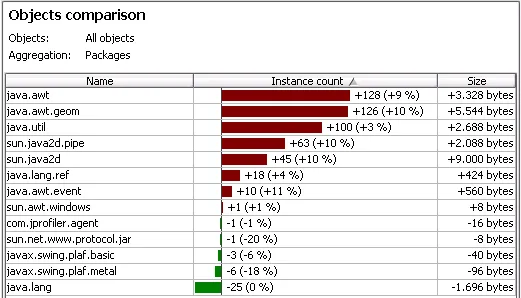
The objects comparison shows the difference between the "all objects" views or the "recorded objects" view
of two snapshots. The difference histogram can display absolute differences or percentage differences, depending on your
choice in the view settings.
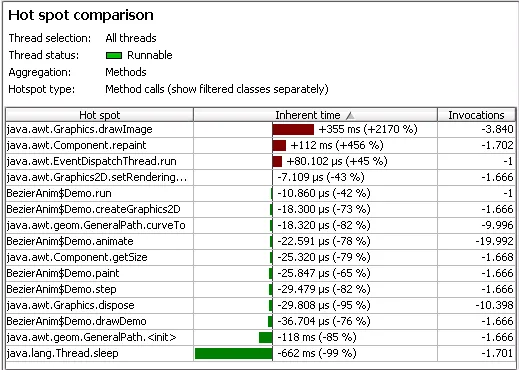
To see the difference between the hot spots view of two snapshots, you can create a hot spots comparison.
The view parameters for the comparison, such as aggregation level or hot spot type, are configured in
the comparison wizard. It's also possible to compare two threads in the same snapshot.
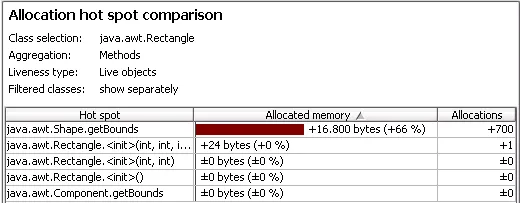
Similar to the CPU hot spot comparison is the allocation hot spot comparison.
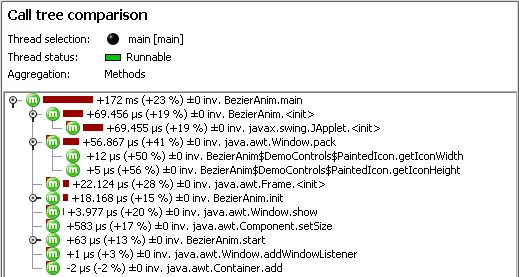
In the call tree comparison, the difference tree of the call tree views of two
snapshots is displayed. Increases are painted in red, decreases in green. You can select in the view
settings, whether to restrict the displayed nodes to common call stacks or whether to display zero
differences.
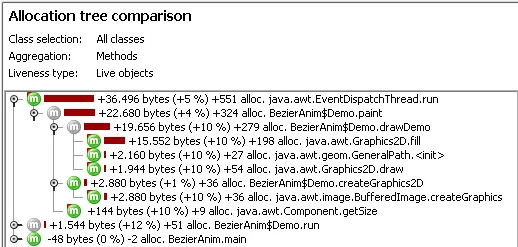
The allocation tree comparison is analogous to the CPU call tree comparison.
Finally, the VM telemetry comparisons show graphs of VM telemetry measurements with a
series of snapshots on the X axis. The numbers on the X axis refer to the legend indicators in the
snapshot selector.
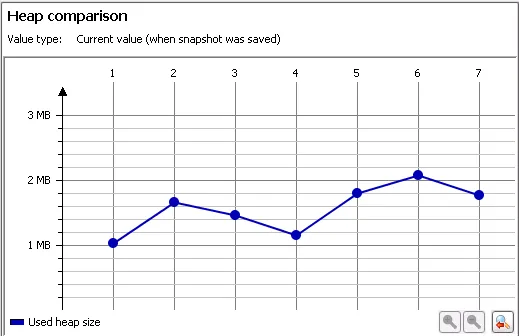
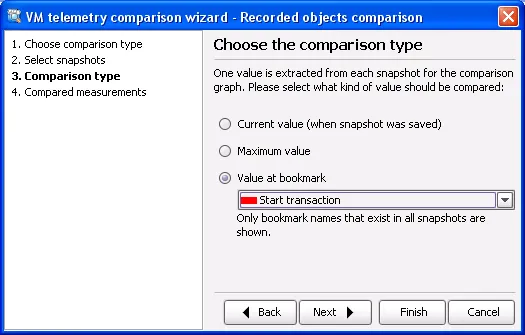
The comparison wizards allow you to tune a lot of parameters for the calculation of the comparison. For example.
you can select a common bookmark for which the VM telemetry measurements should be extracted.
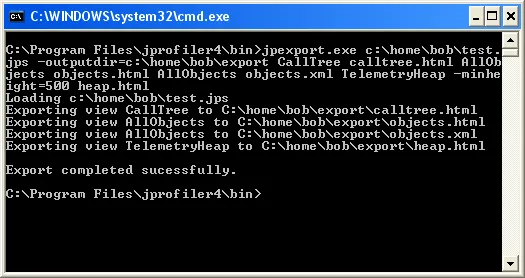
JProfiler now offers command line export. You can take any saved snapshot and export views with
the new jpexport executable. The arguments to jpexport describe the views that should be exported
as well as any parameters for each view. The usage is described in the documentation or printed with
jpexport -help. For each view, an HTML export format as well as a machine-readable format (XML or CSV) are
at your disposal. This functionality is also available from the new "export" ant task.
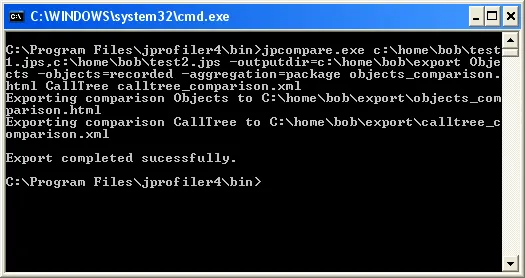
In addition to command line export, this release also brings command line comparisons. This is especially useful
for creating reports against a baseline in an automated fashion. The new jpcompare executable performs this task, it's
usage is printed with jpcompare -help. As with the command line export, you can create multiple comparisons
with a single command. This functionality is also available from the new "compare" ant task.
The way how the heap walker displays and handles classes has been changed to make it easier to search for certain types
of memory leaks:
(1)
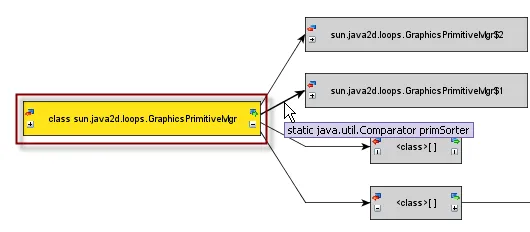
The reference graph in the heap walker now shows java.lang.Class objects as single nodes. This replaces the old
"static field" nodes. You can now see the incoming references for class objects.
(2)
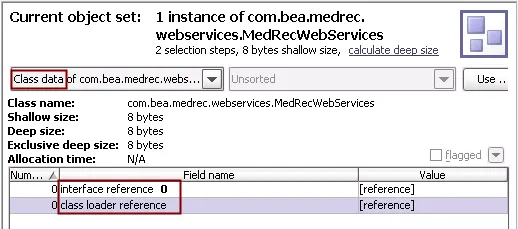
The "class data" table of the data view in the heap walker now shows references to interfaces and to the class loader.
In this way you can easily navigate from a specific instance to the class loader.
(3)
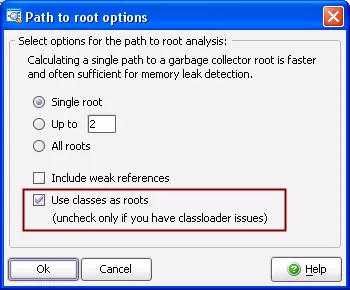
Previously, JProfiler used static fields as endpoints when searching for the path to garbage collector roots.
This is fine for most situations, but inappropriate when you have class loader related memory leaks. Now you
can ask JProfiler to use only the true garbage collector roots.
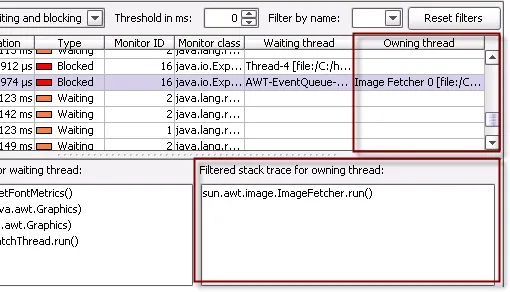
If you profile with Java 1.5 or higher (JVMTI), the monitor usage history view has been enhanced to show the thread which owns the monitor
for all blocking events. In the lower panel, the stack trace of the owning thread is displayed, just like for the current
monitor usage view.
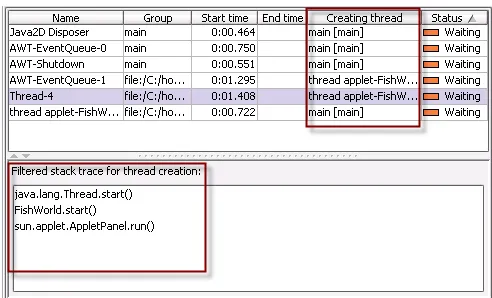
If you profile with Java 1.5 or higher (JVMTI), the thread monitor view gets additional information:
the creating thread and the stack trace for the thread creation in the lower panel.
This data can be very useful for diagnosing problems with excessive or spurious thread creation and is not available through any other
debugging techniques.
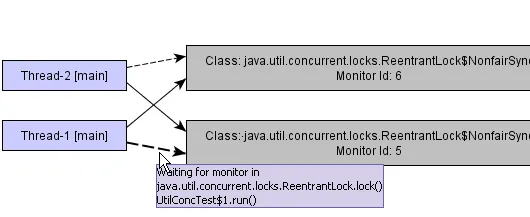
Java 1.5 has added a new facility for concurrency control, the java.util.concurrent package. Since this package doesn't use the
synchronization primitives of the JVM, the thread section so far didn't show any events from this package. From this release
on, deadlocks and monitor usages from java.util.concurrent package can now be analyzed.
JProfiler now tries to preserve your selection across changes in the aggregation level or thread status. This is very useful
for zooming out to get a higher level view, or for drill-down purposes. For example, you might be looking at the call tree in the J2EE
component aggregation level:
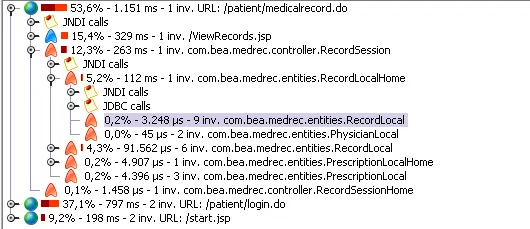
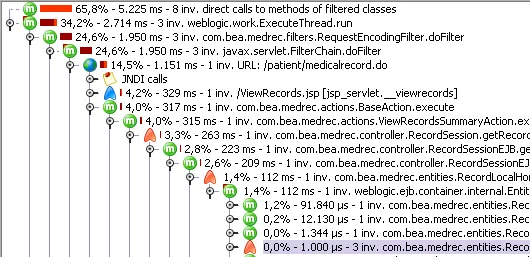
Then you would maybe like to look at the call tree in the method aggregation level to see more details. Previously, JProfiler
would discard your selection. From this release on, JProfiler tries to preserve your selection as shown below.
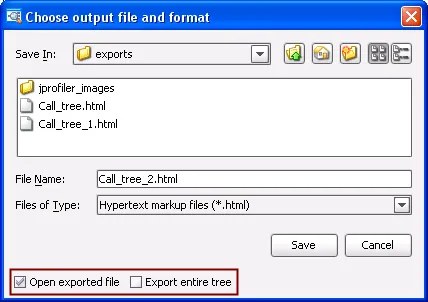
Exporting has been enhanced. For all call trees, you can now select an option in the file chooser to export the entire call tree
instead of just the open nodes. Also, the "open exported file" option has been moved from the general settings dialog to the file chooser
for all exports and is remembered separately for each export format.
The displayed units are now configurable. For every view that displays times or sizes, the view settings dialogs allow you to configure
what units are used. By default, JProfiler chooses the appropriate unit automatically.