- Windows x64/AMD64
- Linux x64/AMD64
- Solaris Sparc V9
- Solaris x64/AMD64
What's new in JProfiler 4.1
Change release:
Please see the change log for a detailed list of changes.
JProfiler 4.1 introduces the following notable new features:
Support for 64bit JVMs.
JProfiler can now profile 64bit VMs on the following platforms:
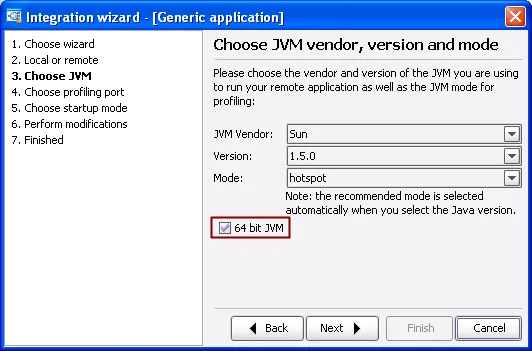
Additionally, JProfiler now supports profiling on Solaris x86.
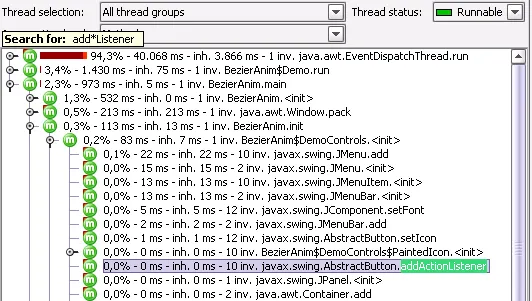
Quick search
in all tables and trees. All trees and tables in JProfiler
can now be searched. Just select the component and start typing or use the
"Find" action from the menu. The matching content will be shown
inverted with a green background. The up and down arrow keys allow you to navigate
between different matches.

The quick search mechanism supports wildcards and covers entire call trees,
not just the visible parts. Searching in trees always starts at the currently
selected node.
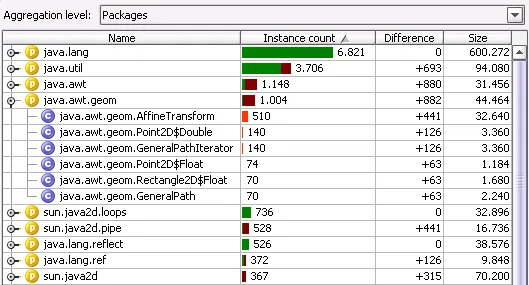
The package aggregation level is now a tree-table view that gives direct
access to the classes that are contained in packages. The improvement applies to the memory views
as well as the heap walker. This makes it much easier to drill down from a high-level
perspective to the actual classes.
Integrations for the newest releases of popular IDEs:
- IDEA 5.0. The integration has been available on the plugin server for some time and is now bundled with this release. It now also supports profiling of multiple IDEA instances so you can profile your own plugins.
- Netbeans 5.0. As for previous version, the integration covers standard and freeform projects as well as profiling of the integrated Tomcat server and the Sun Java System Application Server.
- eclipse 3.2. Since eclipse has many early adopters, JProfiler tries to support milestones in a timely fashion. This release supports eclipse 3.2 M2.
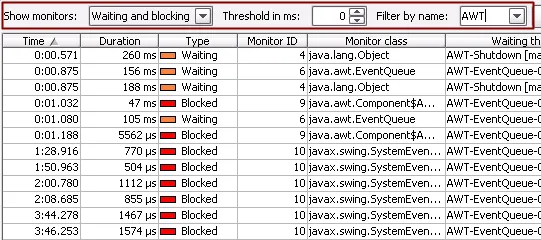
Enhancements in the monitor contention views. The usability of the monitor usage history view
as well as the current monitor usage view is greatly improved by the new filtering controls at the top.
You can now filter by monitor usage type and names of monitor classes, waiting and owning threads.
Also, you can specify a time threshold to hide short usages of monitors.
An ant task that allows you to easily profile applications from your build scripts.
The supplied "profile" task is used like the default "java" task in ant.
A typical usage of the task would look like this:
<taskdef name="profile"
classname="com.jprofiler.ant.ProfileTask"
classpath="C:\Program Files\jprofiler4\bin\ant.jar"/>

<target name="profile">
<profile classname="MyMainClass" offline="true" sessionid="80">
<classpath>
<fileset dir="lib" includes="*.jar" />
</classpath>
</profile>
</target>
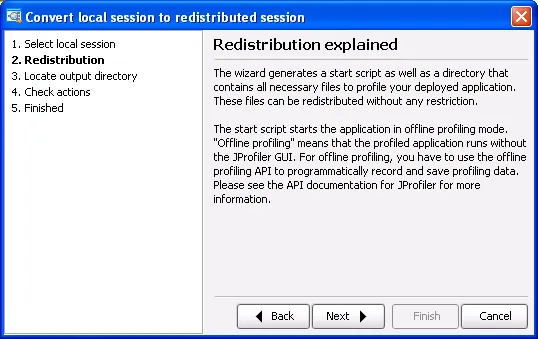
The profiling agent is now easily redistributable. A new conversion wizard helps you distribute
the profiling agent to your customer's machines. The conversion wizards are available from the main menu
(Session->Conversion wizards) or from the "Convert session" tab of the start center.
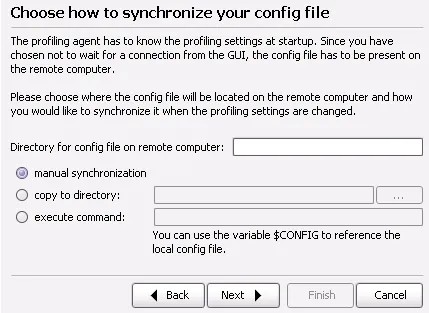
Automatic config file synchronization for remote profiling. When using the option
that the profiled application does not wait for a connection from the JProfiler GUI, the
config file has to be present on the remote machine and has to be synchronized each time
the profiling settings are changed. The new config file synchronization options make this
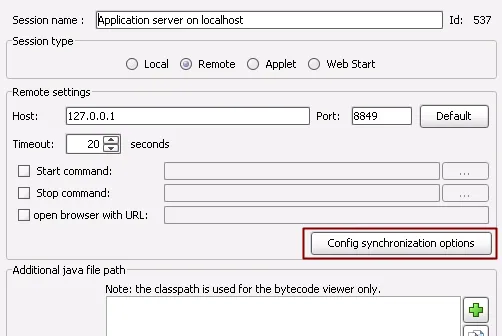
process transparent and much easier. These options can be specified in the integration wizards:
as well as in the application settings of a remote session:
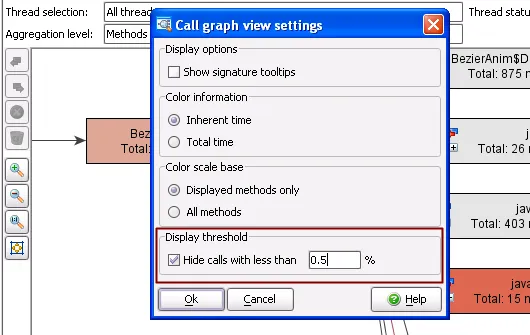
Percentage threshold in call graph. To reduce detail and focus on the most important
methods, you can now define a lower threshold in the call graph view settings similarly to
the already existing threshold in the call tree.
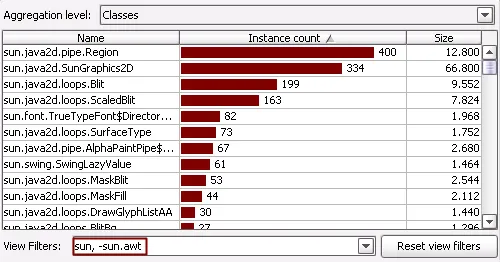
Exclusive view filters. You can now specify classes that you do not want to see in the
view filters, analogous to the exclusive filters in the profiling settings. Simply prefix the package
or class name with a minus sign. You can alternate inclusive and exclusive filters to compose more
complex filters. Filters are evaluated from left to right. In the following example, all classes
from the sun.* packages but no classes from the sun.awt.* packages are shown.
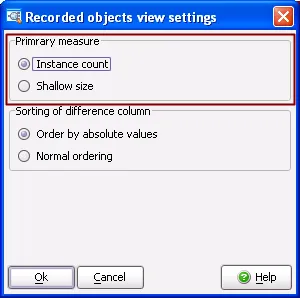
Selectable primary measure
for the "all objects view" and the "recorded objects view" as
well as the classes view in the heap walker. You can select either the instance count or the
shallow size for the primary measure that's used for the graphical representation and for the
difference column. This is especially important when working with arrays.
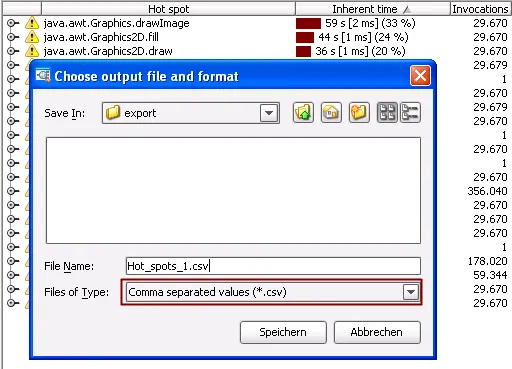
Export hot spots as CSV. In addition to the existing XML export, you can now
export hot spots as CSV. The backtraces are not exported in that case.
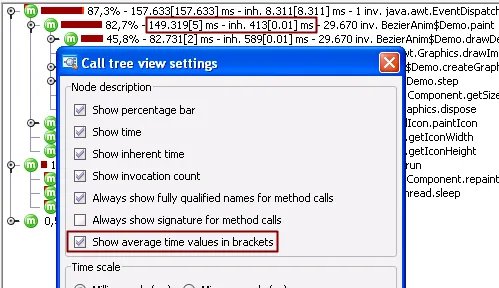
It is now possible to display average value in call trees and hot spots. The average
times are displayed in square brackets right after the total times. The new option can be activated
in the view settings.
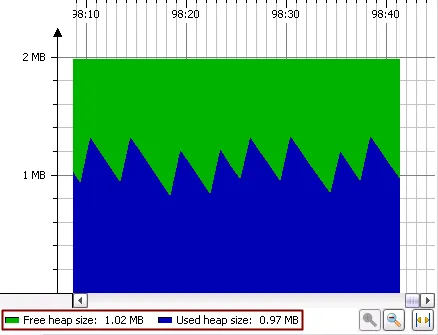
The current values are displayed in the VM telemetry views. Next to the legend entries,
you can always see the current value of a data feed.
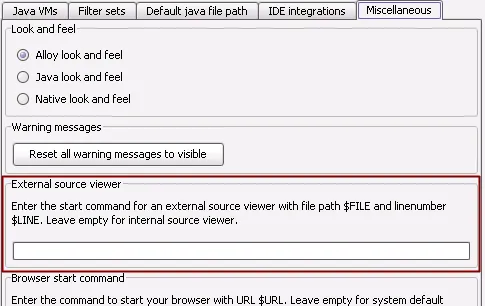
Possibility to define an external source viewer. If you do not use an IDE
integration and if the internal source code viewer in JProfiler does not fit your needs, you can now
specify an external source viewer in the general settings.