What's new in JProfiler 4.0
Change release:
Please see the change log for a detailed list of changes.
JProfiler 4.0 introduces the following notable new features:
Support for the new profiling interface in Java 1.5 and 1.6 (JVMTI).
While the old profiling interface (JVMPI) is still supported in Java 1.5, it will
be removed in Java 1.6. Also, the JVMTI has a number of advantages:
Taking a heap snapshot is much more stable and requires less memory than with
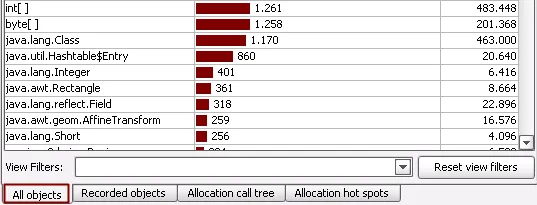
JVMPI. It also works with the standard garbage collector. Based on the new functionality in JVMTI,
JProfiler offers a new "All objects" view that shows all objects on the heap. This provides useful
supplemental information to the "Recorded objects" view. The "All objects" view
is only visible when you profile with Java >=1.5.
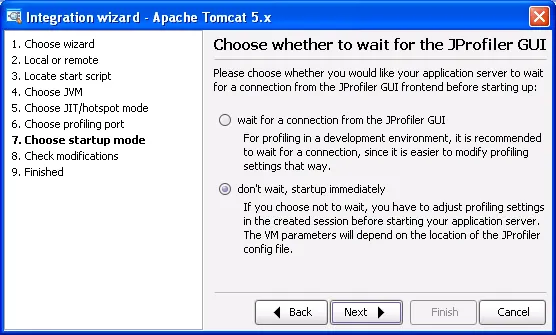
A non-blocking startup mode. You can now start your application server with profiling
enabled and attach JProfiler at any later time. JProfiler 4 offers on-demand profiling
since it now creates a very small overhead when CPU and allocation recording are switched off.
In addition, with JProfiler 4 we now recommend to profile with the hotspot compiler enabled.
Furthermore, JProfiler 4 consumes less memory and is faster, even when you
record CPU and allocation data. All of this means that you can use JProfiler in a production
environment, should the need occur.
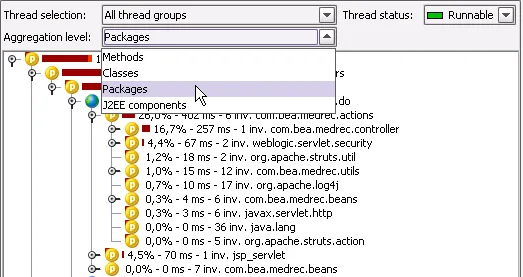
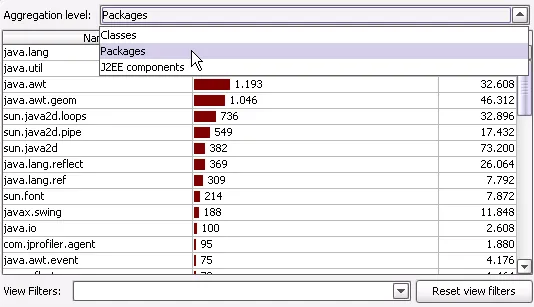
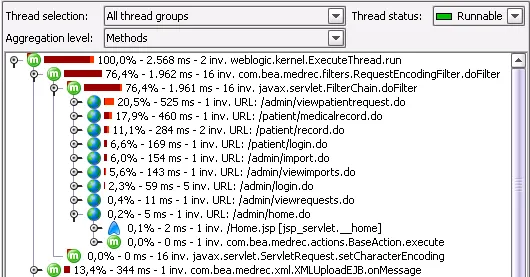
Aggregation level selectors in the call tree and hot spot views. You can
choose whether you would like to display methods, classes, packages or
J2EE components. The screenshot below shows the call tree for the "packages"
aggregation level. As visual enhancements to the call tree, informative type icons
are displayed for all nodes, and a percentage bar is now drawn after the icon that
gives quick visual feedback about total and inherent time. Filtered classes are
now drawn with a red marker.
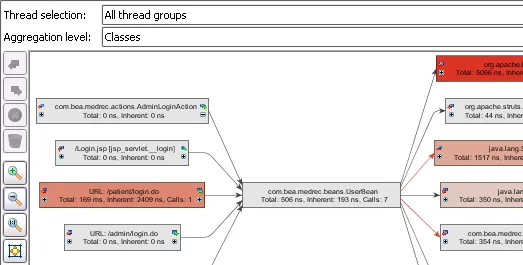
The call graph can be calculated for all aggregation levels as well. In the
example below, the aggregation level is set to "classes".
Aggregation level selectors for the "Recorded objects" view, the "All objects" view
and the classes view of the heap walker. Available aggregation levels are "classes", "packages"
and "J2EE components".
J2EE component detection. JProfiler can now recognize servlets, JSPs, and EJBs
and displays them with separate icons and display names in the call trees and hot spot
backtraces. This works for all application servers without any additional configuration.
Note the blue triangle for the JSP page and the red triangle for the EJB method.
JProfiler substitutes container-generated class names with file names of JSPs and the EJB
interface names. This makes the interpretation of the call tree much easier.
The J2EE component level aggregation shows a reduced view through the J2EE stack.
This allows you to take a high-level view with the call tree or call graph.
JProfiler can now measure JDBC, JMS and JNDI calls and annotate them into the call tree.
This works independently of the implementation of drivers and providers and does not
need any configuration. All J2EE service calls are grouped by their type and subsequently by their
description.
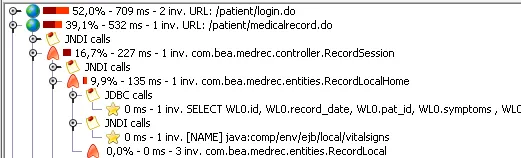
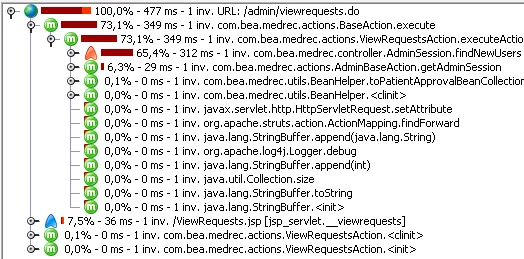
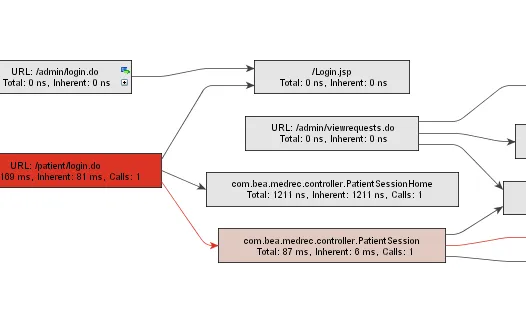
Call tree splitting for request URLs. JProfiler can now split the call tree
every time a new request URL is passed to a servlet or JSP. The exact splitting criteria
can be configured or even performed with a custom handler through the API. This
feature allows you to analyze the call tree separately for separate classes of requests.
In addition, it helps you to pinpoint URLs that are performance bottlenecks.
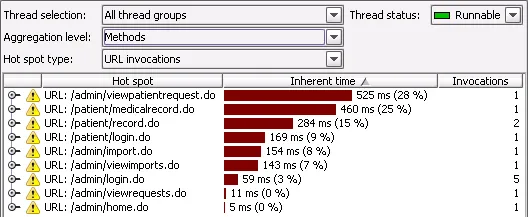
Hot spot types. Previously, JProfiler would only display hot spots for method calls.
Now, JProfiler can also calculate hotspots for JDBC calls, JMS calls, JNDI calls, and
URL invocations. This feature allows you to analyze the call tree separately for separate
classes of requests. In addition, it helps you to pinpoint URLs that are performance
bottlenecks. Below you see a list of URL hot spots.
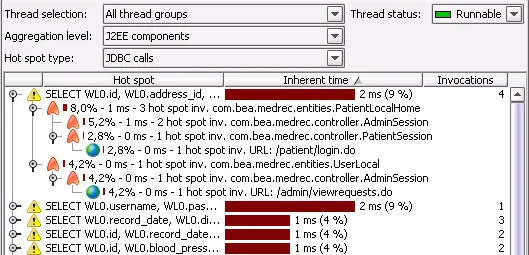
Together with the aggregation level, you have a powerful instrument for determining
where performance bottlenecks come from. The screenshot below shows a list of JDBC hot
spots with the J2EE component level aggregation selected for the backtraces.
Bookmarks. Often it is important to compare different views at the same time.
In JProfiler 4, you can set a bookmark in one view and have it displayed in all time-resolved
views at the same point in time. You can add a marker at the current time with the bookmark
toolbar button or place markers at times in the past with the context menu. Bookmarks have a description
that is displayed in a tooltip window when you hover with the mouse over the bookmark line.
All bookmarks can be renamed manually.
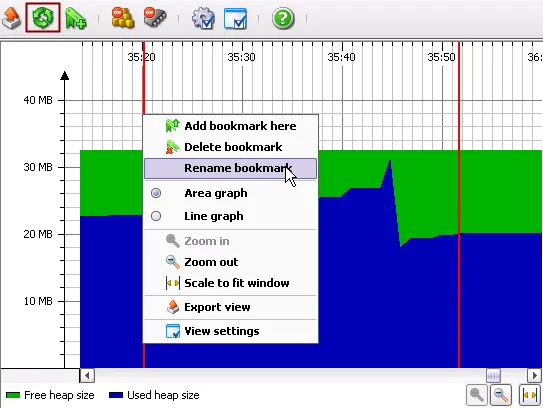
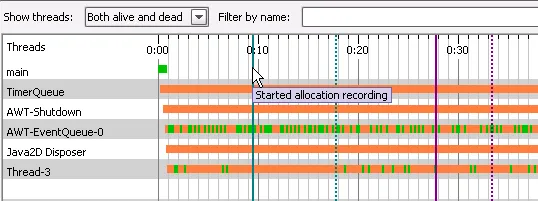
In addition to manual bookmarks, JProfiler sets automatic bookmarks when you start or stop CPU
or allocation recording. If you would like to set bookmarks programmatically, you can do that with
the profiling API.
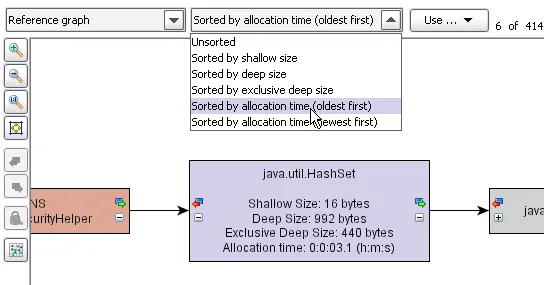
Recording of object allocation times. You can now optionally record the
allocation times for recorded objects. This allocation time will be displayed
in the reference graph and the data view of the heap walker.
What's most important, you can now sort your object sets chronologically, either
oldest first or newest first.
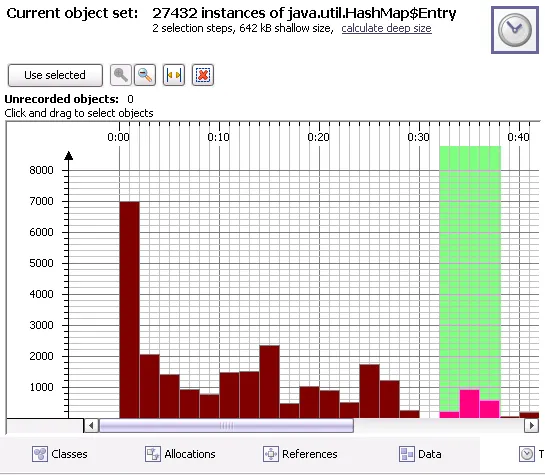
Time view in the heap walker. The new time view in the heap
walker shows you a time-resolved histogram of object allocations. You
can select multiple time intervals and create new object sets based on your selection.
Together with the new bookmark feature, it's now possible to answer a new class
of memory-related questions.
The heap walker can now calculate the retained size of single objects or
object sets. The retained size is the amount of memory that would be freed if the
object or objects set in question were removed. In this way, you can determine how
much memory is really held on to by one or multiple objects.
The retained size is displayed in the reference graph and the data view of the heap walker.
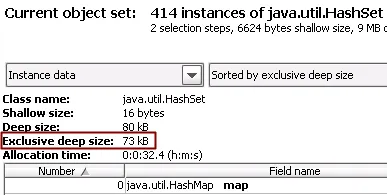
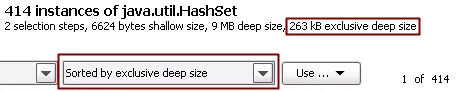
The retained size for an entire object set can be found in the title area of
the heap walker. If you're trying to reduce memory consumption, you can sort object
sets by the retained size to find the objects that will lead to the biggest savings.
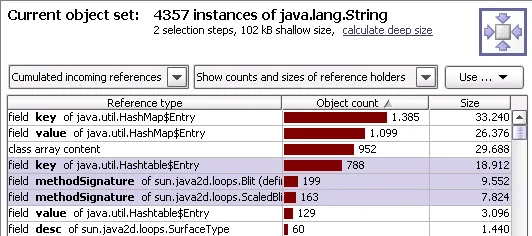
You can now select multiple references in the cumulated references view of the heap walker. This enhances
the flexibility when creating new object sets.
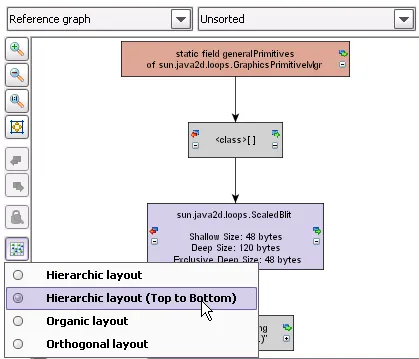
A hierarchical top-to-bottom layouter was added to the reference graph in the heap walker.
This makes it easier to read long chains of references.
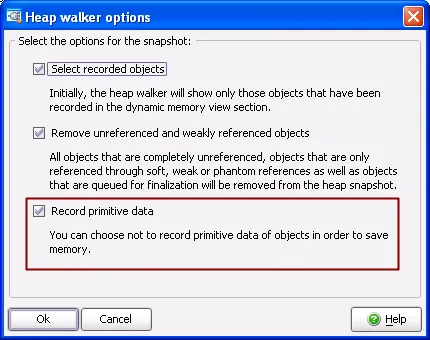
For Java <=1.4 (JVMPI), you can now optionally not record primitive object data in the heap walker.
This reduces the memory requirement during a heap snapshot. When profiling with Java >=1.5 (JVMTI),
primitive object data is always requested on demand, so this option will not be visible.
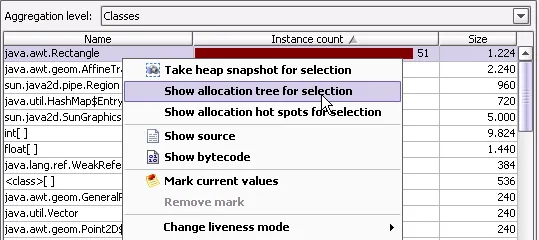
Integration of recorded objects view and allocation views. To make it easier to jump from the
recorded object view to the allocation views, the context menu offers actions for calculating
the allocation call tree or the allocation hot spots for a selected class.
The allocation call tree and the allocation hot spots are now class-resolved by default.
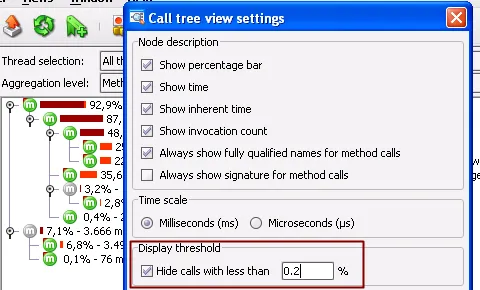
Threshold for the call tree. In order to be able to focus on the most time-consuming methods,
you can define a threshold for the inherent time in the call tree view settings. Only methods
with an inherent time greater than the defined percentage of the total time will be displayed.
Intermediate method nodes below the threshold that have to be drawn in order to complete the call tree
are displayed with a grayed out icon.
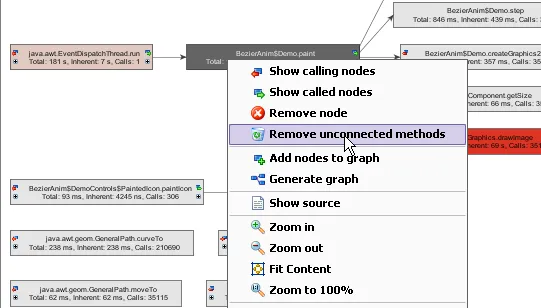
Remove unconnected methods in the call graph. When you work with the call graph,
you can end up with lots of unconnected methods if you delete call nodes. To help you
clean up the call graph, an action was added that removes all methods that are not connected to the
selected method.