What's new in JProfiler 3.3
Change release:
Please see the change log for a detailed list of changes.
JProfiler 3.3 introduces the following notable new features:
The eclipse 3.x integration was rewritten. The new integration now supports all standard run types
in eclipse. Profiling and running your applications are now very similar.
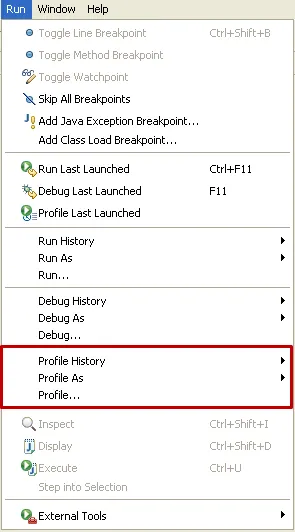
The IDEA 4.x integration was also rewritten. The new integration now supports all standard run types
in IDEA including web applications.
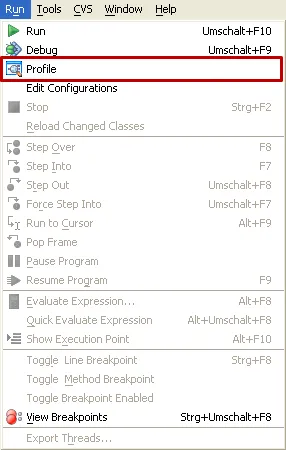
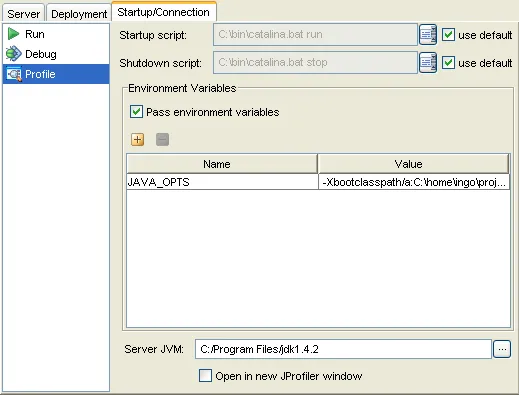
Profiling settings are now configured in the startup/connection section of the "Edit configurations"
dialog.
A new JDeveloper 10g integration was added. All types of run targets can be profiled from
within JDeveloper.
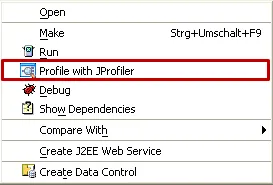
A new IDE integration for Netbeans 4.0 was added that allows you to profile standard Java
projects and web projects conveniently from within Netbeans 4.0.
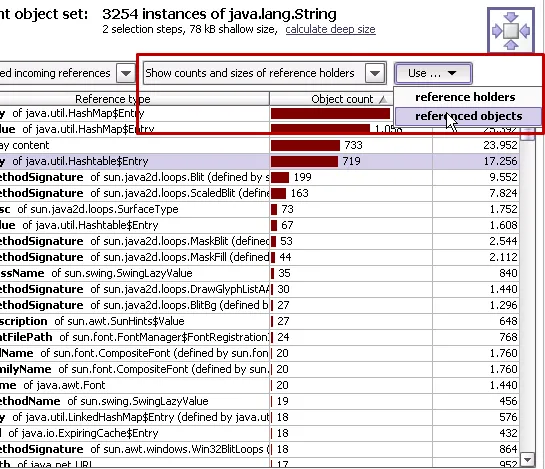
In the cumulated incoming reference view of the heap walker, you can now either display
the counts and sizes of the reference holders or of the referenced objects.
Also, there are now two corresponding selection steps. This makes
it much easier to work with certain kinds of memory leaks.
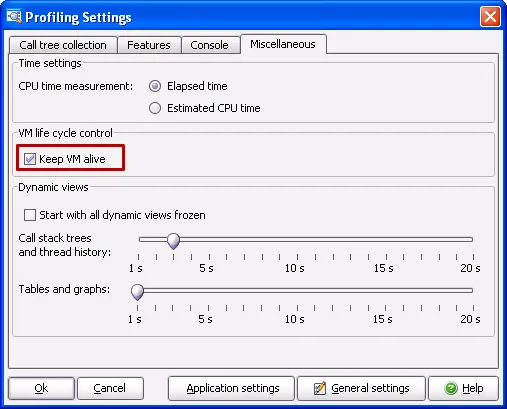
JProfiler can now reliably keep the VM alive so you can continue to analyze profiling data
even after the application has exited.
JProfiler now consumes a lot less memory than previous versions. This and other enhancements
as well as bug fixes ensure a much better stability when profiling for extended periods of time.
Many new integration wizards were added. New integration wizards include:
- IBM WSAD (server integration)
- Pramati 3.5 and Pramati 4.x application server
- Websphere 4.0 Advanced Edition
- Sun Java System Web Server
- Sun Java System Application Server
- Oracle 10g Application server
- Apple WebObjects Developer 5.x