What's new in JProfiler 3.1
Change release:
Please see the change log for a detailed list of changes.
JProfiler 3.1 introduces the following notable new features:
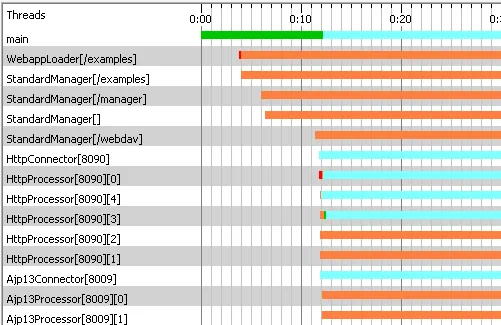
New "net I/O" thread status in CPU and thread views. CPU times in the "Runnable"
state are now much more accurate for applications that work with network sockets. Previously,
blocking net I/O was partly attributed to the "Runnable" state. The light blue color
in the thread history view now shows when threads were engaged in blocking network
operations.
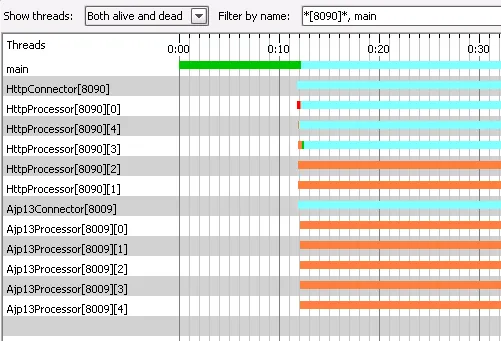
Filtering controls for threads in thread history view. You can now display
live or dead threads only and filter threads by entering name patterns with wildcards.
This greatly enhances the manageability of this view for applications which produce
a lot of threads.
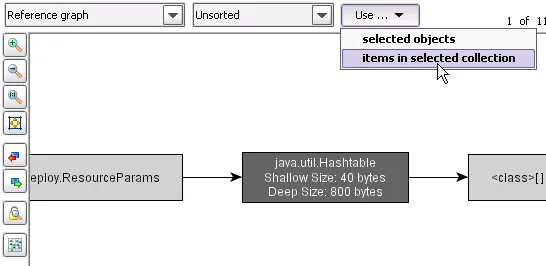
Improved selection capabilities in the heap walker. In the reference
graph, it is now possible to select multiple objects by pressing the SHIFT key.
You can now select the contents of standard collections and arrays of objects.
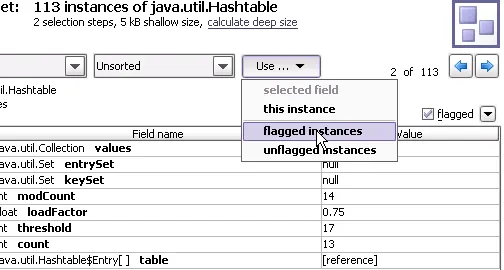
In the data view, you can now flag certain instances and create a new object
set from them.
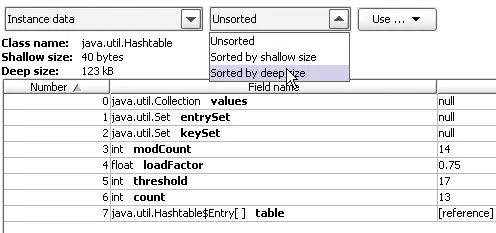
Sorting instances in the heap walker. In the reference graph and the data view
of the heap walker, the instances can be sorted by shallow and by deep size.
This makes it much easier to find objects which reference a great amount of memory.
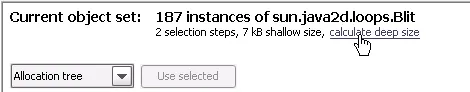
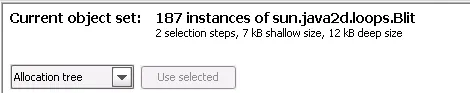
Calculation of the deep size of object sets in the heap walker.
In the header area of the heap walker, you can click on a hyperlink to
calculate the deep size of the entire object set. The hyperlink is then replaced
with the result.
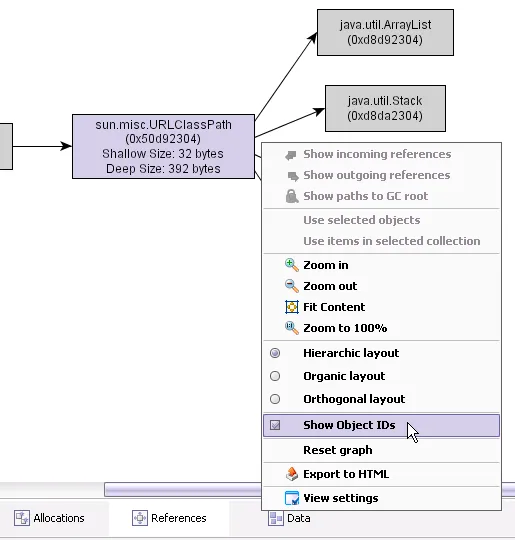
Display enhancements in the reference graph. You can now optionally display
object IDs in the reference graph. This can help you to find out if two objects
in different reference graphs are the same. Also, the shallow and the deep size for the
current object are now displayed.