What's new in JProfiler 3.0
Change release:
Please see the change log for a detailed list of changes.
JProfiler 3.0 introduces the following notable new features:
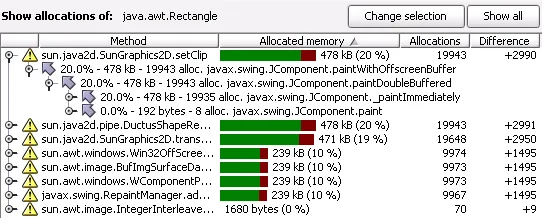
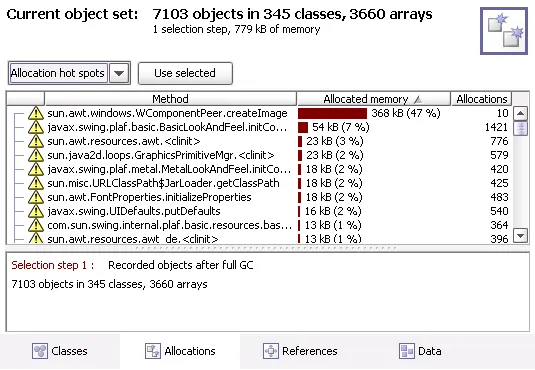
The allocation hot spots view. This new view complements the allocation tree view and
makes memory leak detection much easier than before.
You can mark all values and observe the differences, just like in the class monitor.
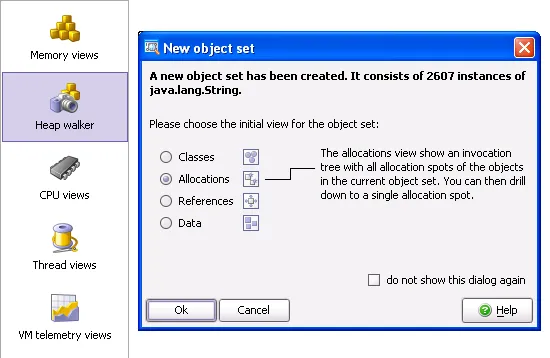
Integration of the memory views with the heap walker. You can now select a class or allocation spot
and analyze the selected objects in the heap walker with a single click.
A redesigned heap walker. Based on user feedback we've made the heap walker
more intuitive and much easier to use.
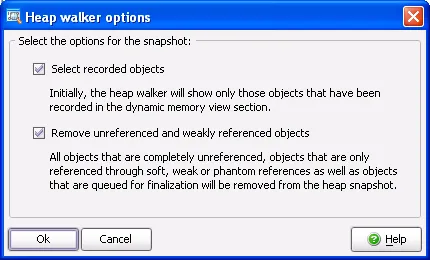
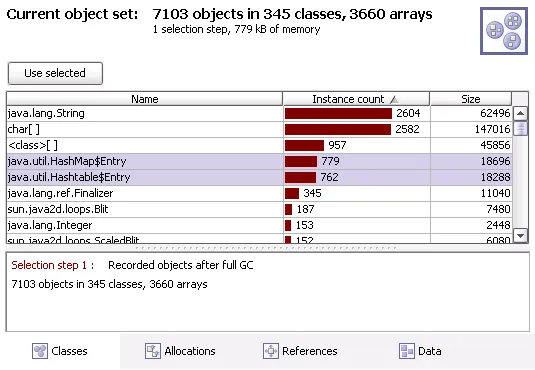
The heap walker can be told to show only recorded objects. Now the heap walker fully
integrates with the dynamic memory views and makes it much easier to focus on the objects
you're interested in.
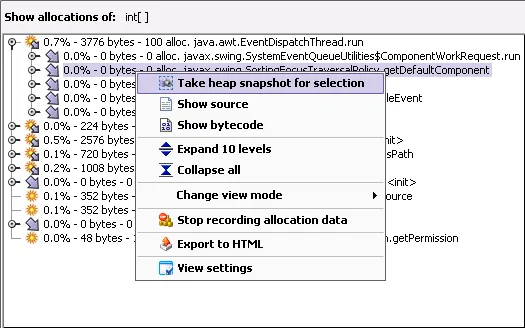
Multiple selection in heap walker views. You can now select multiple classes or
allocation spots to form a new object set. For many cases this makes it much faster to
find objects.
Allocation hot spots in the heap walker "Allocations" views. This view gives you additional
insight into object creation and allows you to make selection steps that were not possible before.
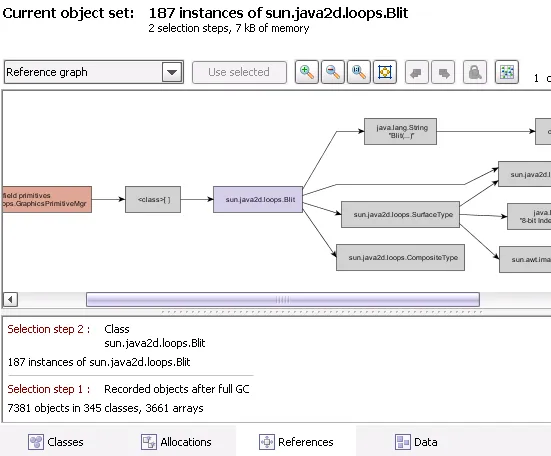
The reference graph. With the reference graph, you can explore references individually for each object.
Searching for memory leaks is now much easier than before.
The cumulated reference views are still available.
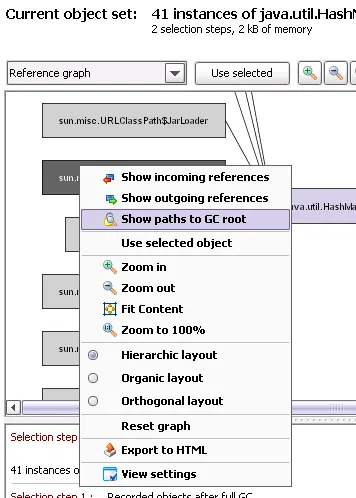
Path to GC root search in the reference view. Previously, the path to root search was located in the
instance data view of the heap walker. The new path to root search in the reference graph
is much better located and more useful.
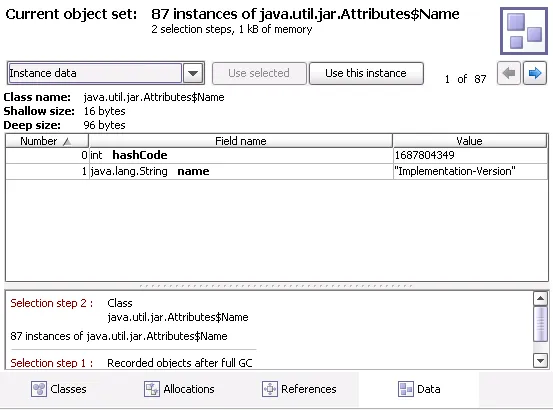
Direct display of string values
in the data view of the heap walker.
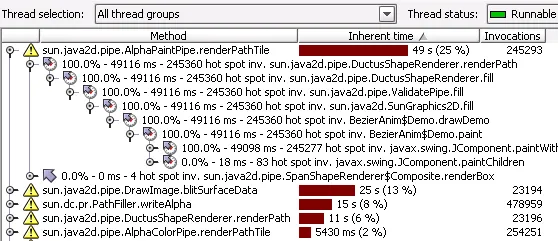
Redesigned CPU hot spots view. The bar graph instantly shows you the relative importance of
hot spots. The view now has a table-like structure and can be sorted by name, percentage and
invocation count.
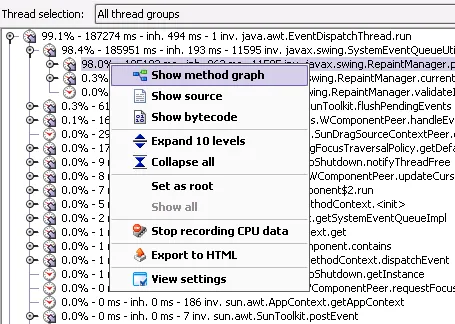
The method graph. In addition to invocation tree and hot spots view, you can now explore
call sequences as a graph.
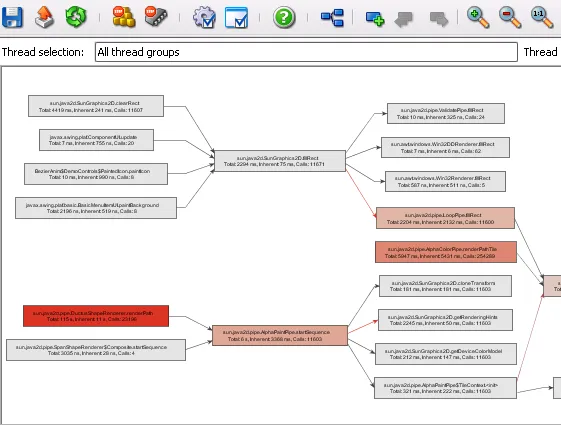
Integration of the CPU views with the method graph. You can create a method graph from every
method in the invocation tree view and the hot spots view with one click.
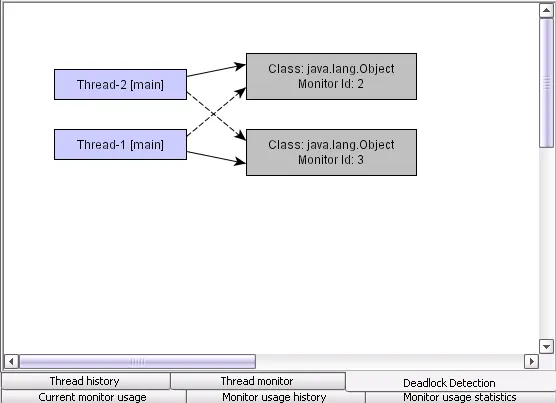
Automatic deadlock detection. The deadlock detection graph shows a graphical representation
of all deadlocks in the JVM.
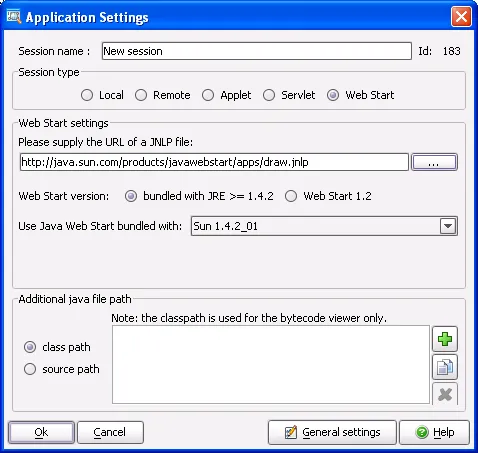
Support for recent versions of Java Web Start. Java Web Start bundled with 1.4.2 can
now be profiled with JProfiler.
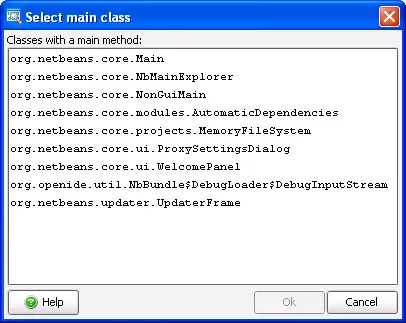
Easy main class selection for local sessions. Once you have set up your class path,
JProfiler can list your main classes.
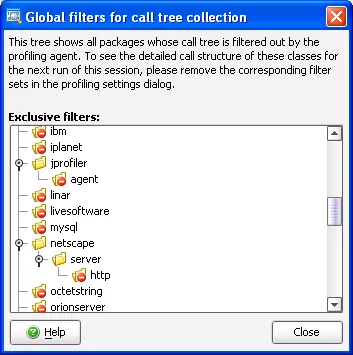
Displaying a tree of call tree collection filters at runtime. This information
was previously difficult to access.
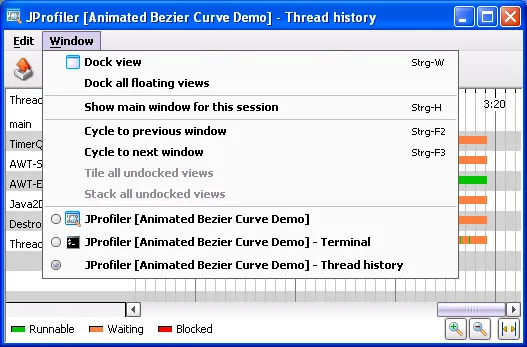
Undocking of all views to separate top-level windows. If you ever wanted to look at
two or more views side by side, this feature is for you.
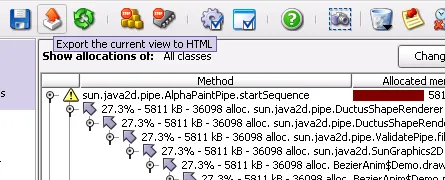
Much improved export capabilities. Now all views can be exported to HTML.
New IDE integrations
for:
- IntelliJ IDEA 4
- Netbeans 3.6
- Eclipse 3.0M7
- Borland JBuilder X