JProfiler 13.0 introduces the following notable new features:
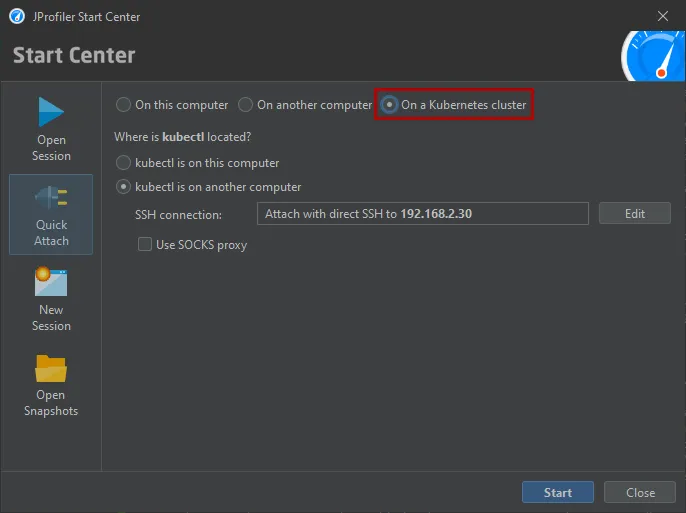
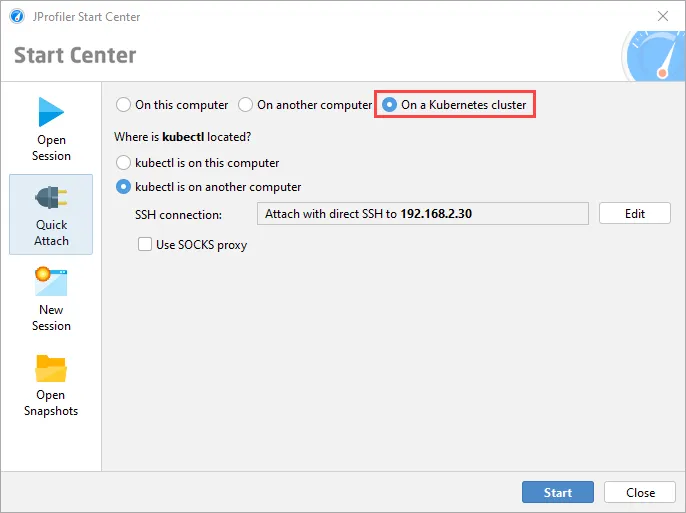
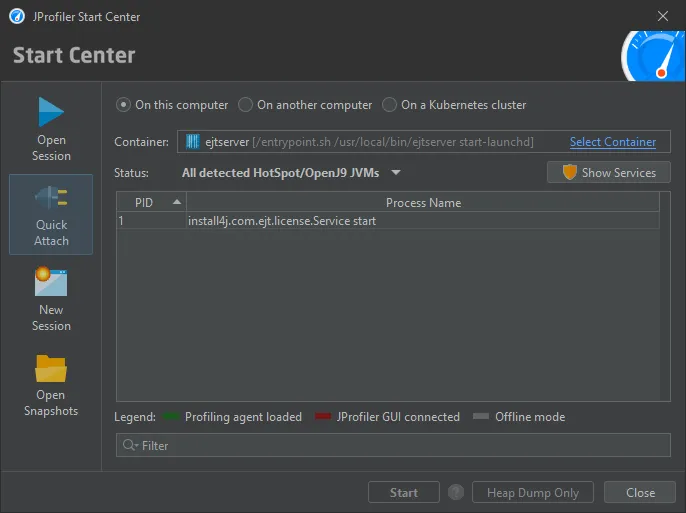
Support for attaching to JVMs running in a Kubernetes cluster has been added. The attach window now offers three main modes: Besides
the existing radio buttons for JVMs running on the local machine and a remote machine there is now a Kubernetes cluster option.
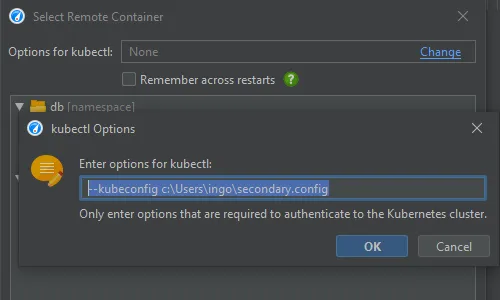
JProfiler uses the "kubectl" command line utility which can be available locally or on a remote machine via SSH.
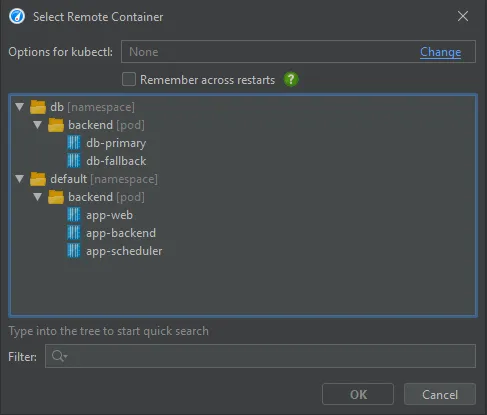
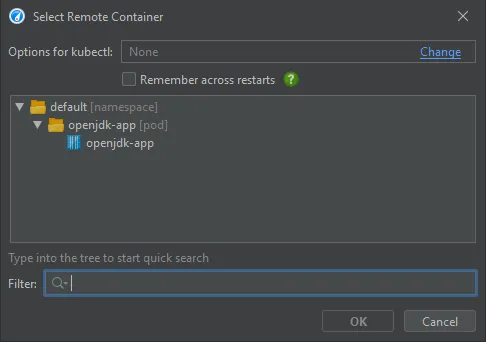
After clicking on "Start", you can select a container in a tree of Kubernetes namespaces and pods.
JProfiler assumes that kubectl is already configured to connect to your cluster. If special command line options are required, they can be
configured at the top of the dialog and can be made persistent on request.
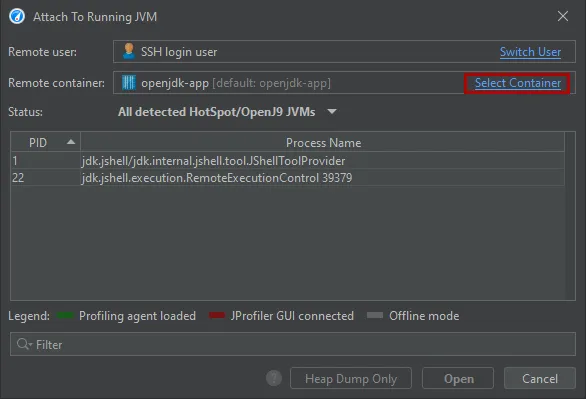
After selecting the container, you can select from all JVMs that are running in the container. Should you need to switch to another container
in your Kubernetes cluster, you can do so with the "Select Container" action.
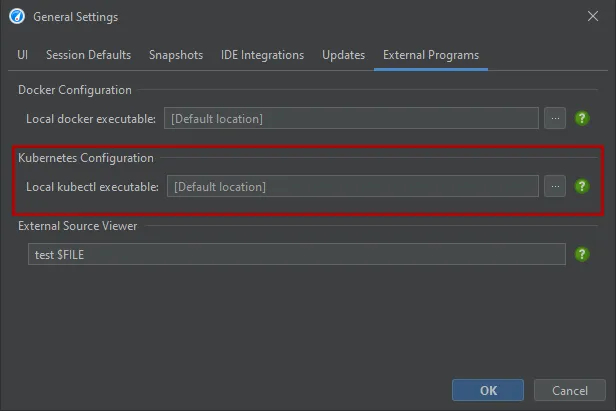
If you choose to execute kubectl locally, the location of kubectl is detected automatically and can be adjusted in the general settings if
required.
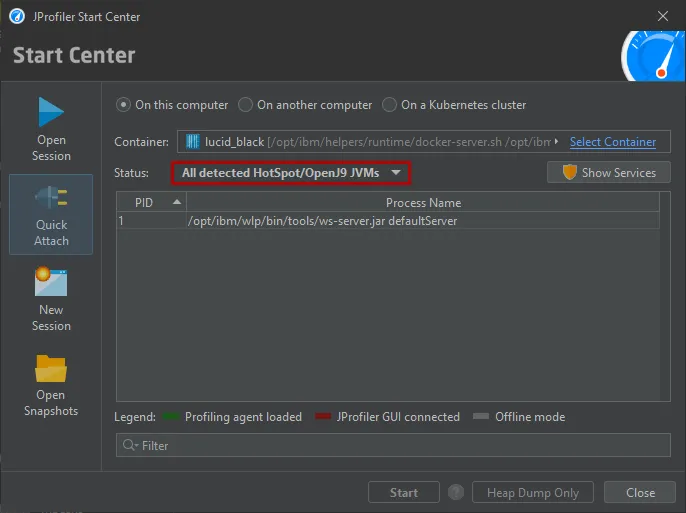
JProfiler can now attach to JVMs running in Docker Desktop on Windows and macOS and on local Docker installations on Linux.
Previously, only Docker on remote Linux hosts was supported.
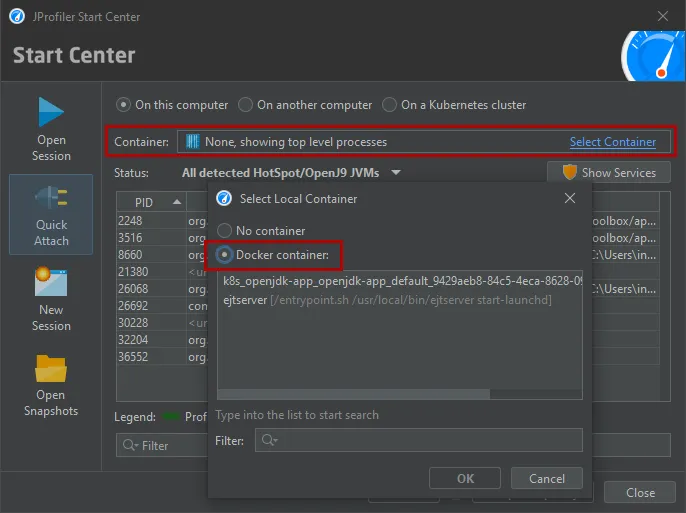
To attach to a Docker container that is running locally, go to the "Quick attach" dialog, select the "On this computer" section and click on the
"Select Container" link.
After selecting the container, the list of JVMs that are running in the container will be shown and you can proceed just like when attaching
to a JVM that is running directly on the local machine.
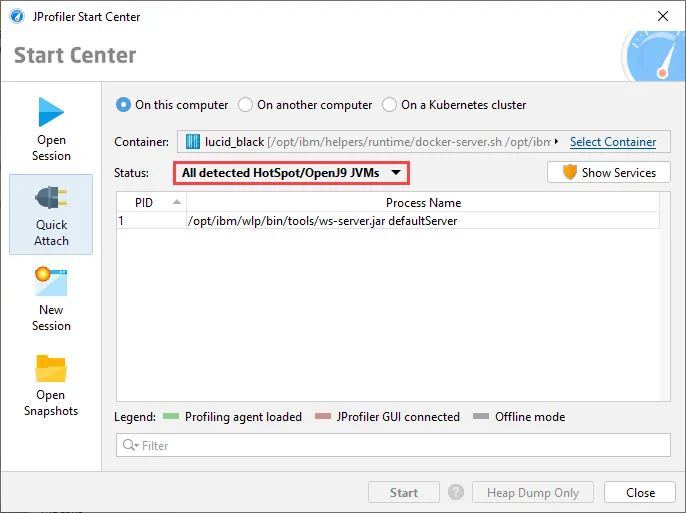
As shown above, the selection dialog may contain locally running Kubernetes containers. You can also use the Kubernetes attach
instead of the Docker attach in this case. Instead of generated names starting with "k8s", the local Kubernetes attach will show
more informative container names.
Support for attaching to OpenJ9 JVMs has been added. It requires a recent OpenJ9 JVM (8u281+, 11.0.11+ or Java 17+) or an IBM
JVM that is based on such a release.
Previously, the only way to profile OpenJ9 and IBM JVMs was to add the -agentpath VM parameter at startup.
This is especially important for profiling OpenJ9 and IBM JVMs running in containers where attach mode is the only way to profile without
undesirable modifications of the container. For example, you can now attach to the Websphere Liberty
Docker container without any further configuration.
Attach functionality has been improved in several ways:
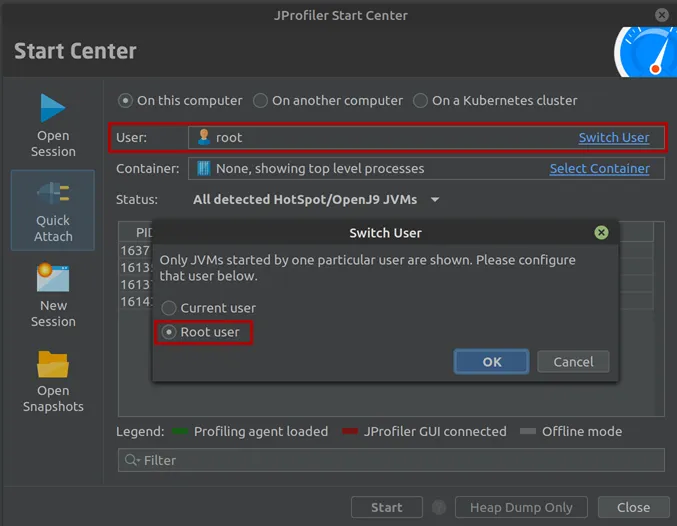
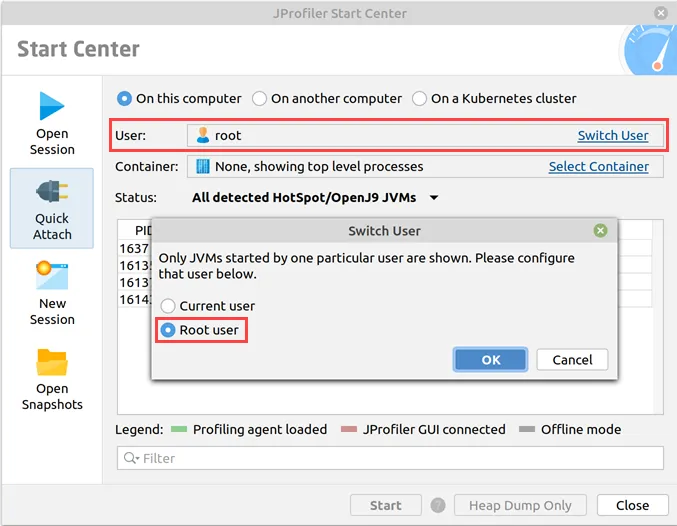
- A user switcher has been added on Linux to profile JVMs started by different users
- Support has been added for attaching to JVMs running in Redhat UBI-minimal images
- FreeBSD and AIX are now supported target platforms for the remote attach functionality
- On Windows it is now possible to attach to a JVM started by the same user but running in a different session
- Elevated users can now attach to JVMs started by any user with jpenable on Windows when the PID is provided as long as the JProfiler installation is readable for that user
- Different temporary directory settings for JProfiler and the profiled JVM no longer prevent attaching on Windows when a PID is provided for jpenable
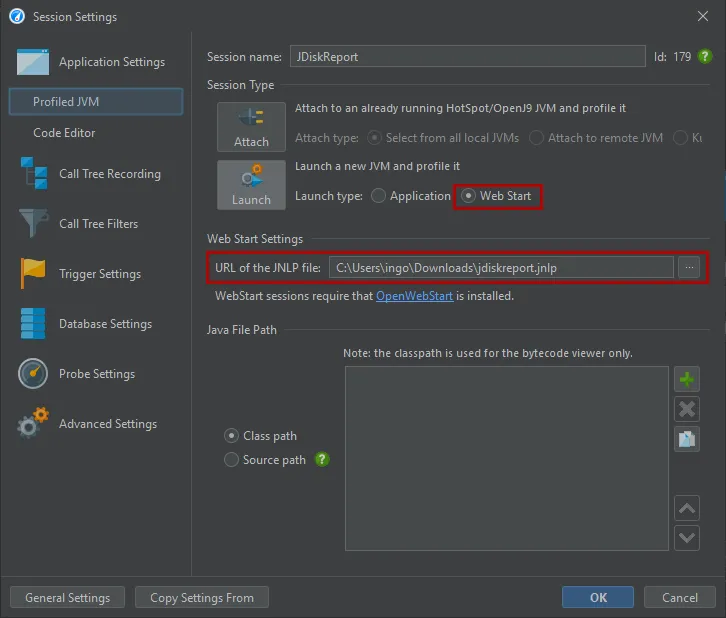
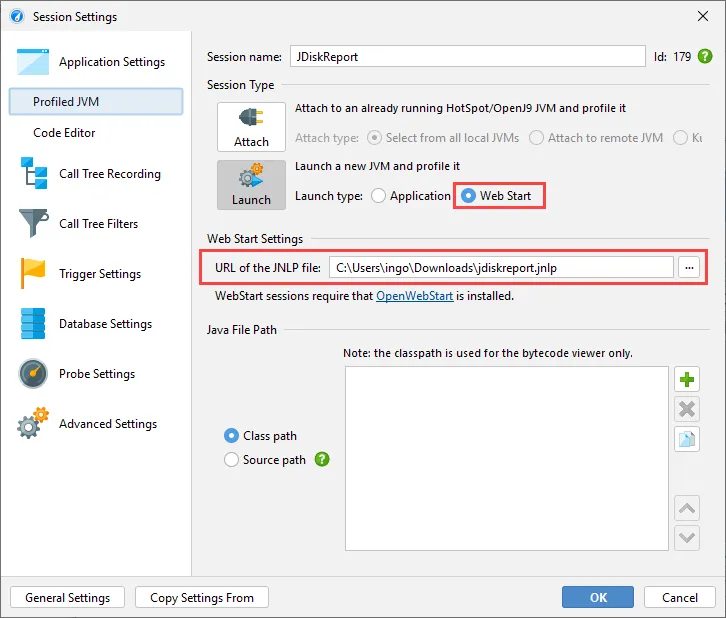
OpenWebStart can now be profiled by JProfiler. After the discontinuation of Java Web Start in Java 11,
OpenWebStart has been developed as a drop-in open source reimplementation based on IcedTea-Web
by RedHat.
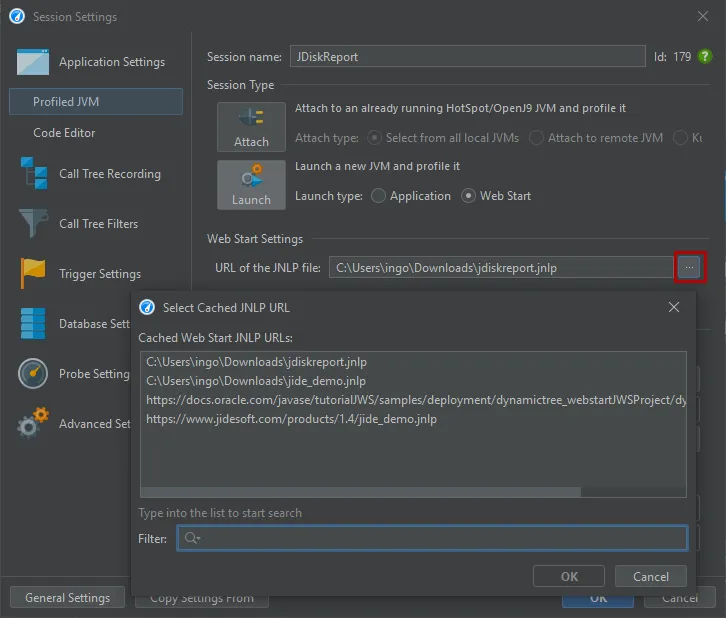
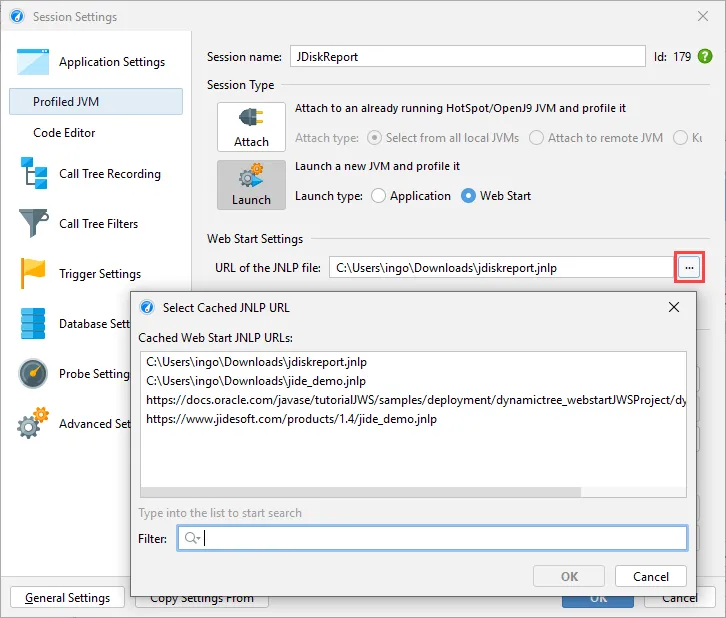
JProfiler now offers a Web Start session type where the only thing that you have to configure is the JNLP URL in order to start profiling.
All JNLP URLs that have already been executed by OpenWebStart are shown in the chooser dialog.
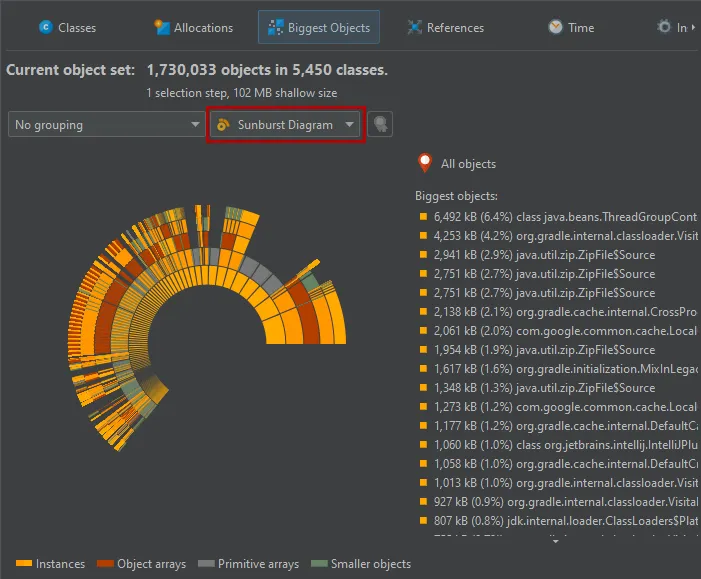
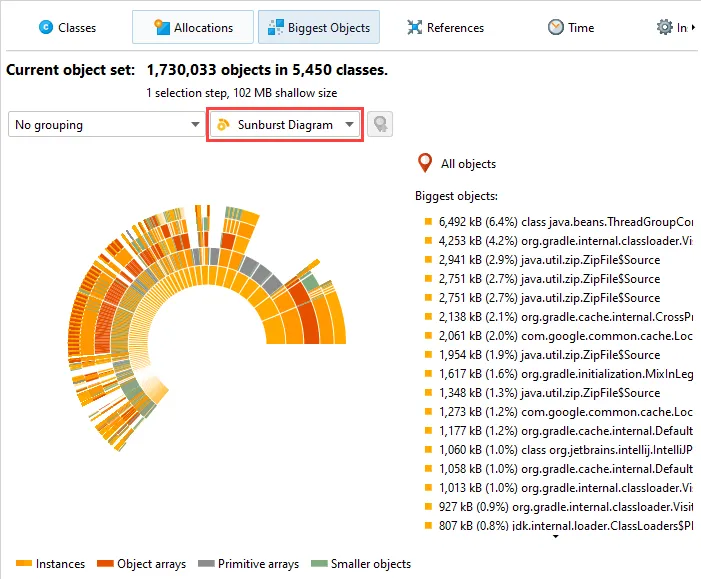
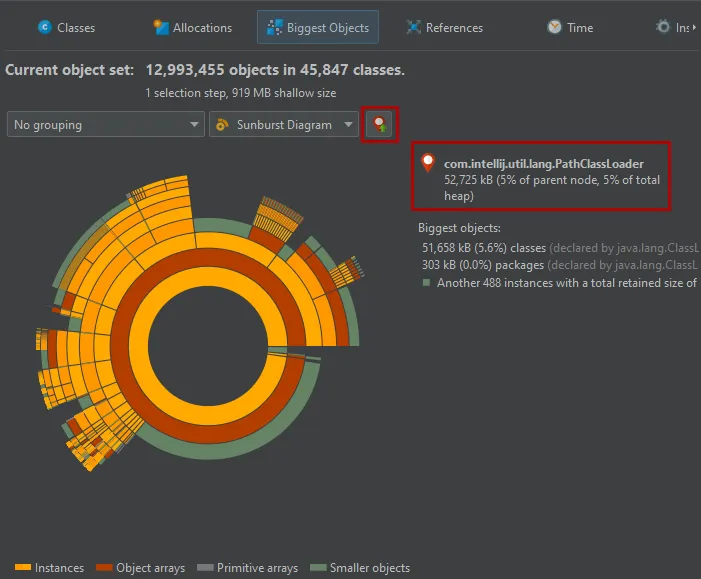
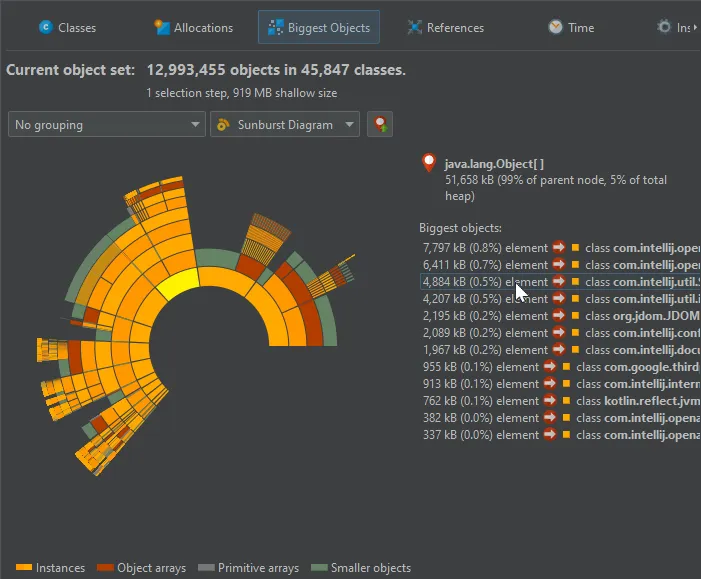
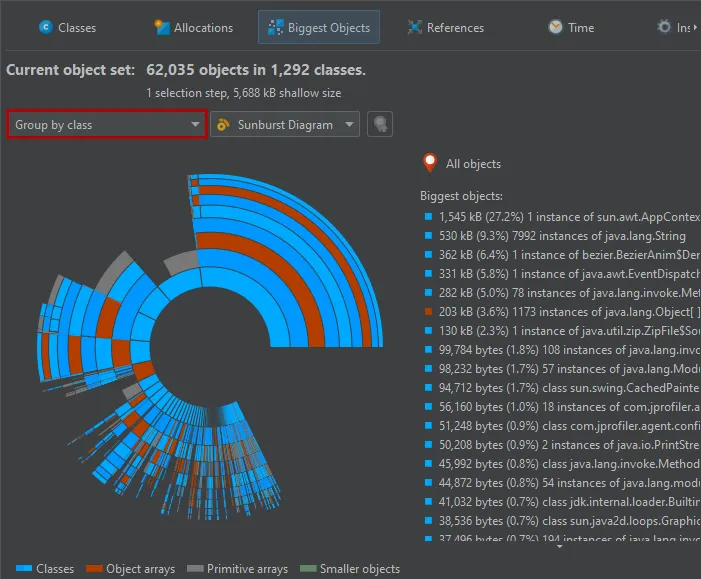
A sunburst diagram visualization has been added to the biggest objects view of the heap walker. By default,
the biggest objects view continues to show the tree view, but you can change the display with the view mode chooser at the top.
The diagram is composed of a series of concentric segmented rings and shows the entire content of the dominator tree up to
a maximum depth in one single image. References originate in the innermost ring and propagate towards the outer
rim of the circle.
This visualization gives you a flattened perspective with high information density that allows
you to discover reference patterns and see large primitive and object arrays at a glance through their special
color coding.
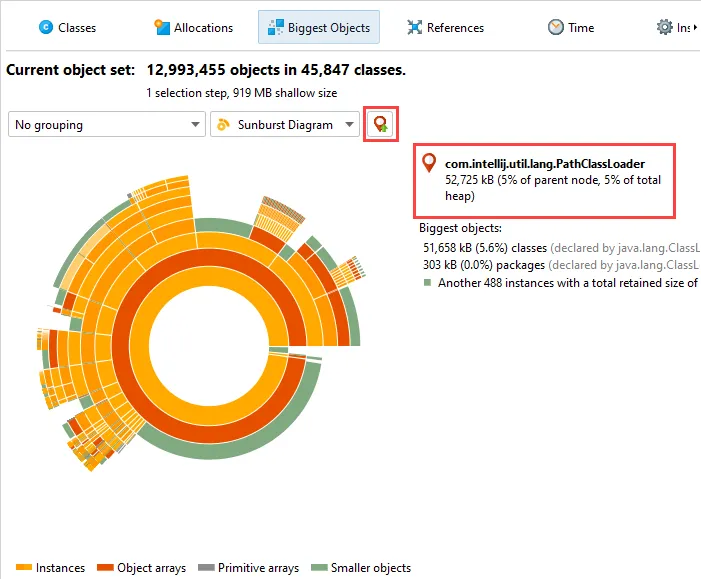
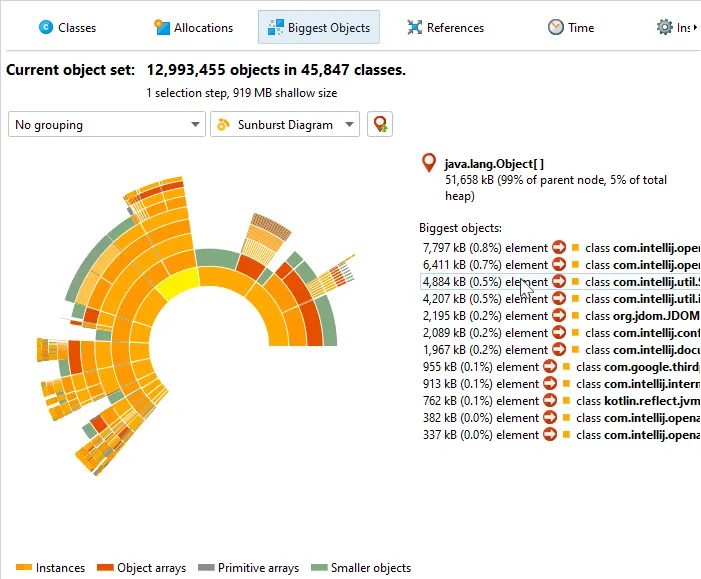
Clicking on any ring segment sets a new root for the circle, thereby expanding the maximum depth that you can
see in the diagram. Clicking on the hollow center of the diagram restores the previous root.
More information about instances and their immediately retained objects is displayed on the right side of the
diagram when you hover over them with the mouse. When the mouse is outside any ring segment, the list on the
right side shows the biggest objects in the innermost ring.
Hovering over the list of biggest objects on the right highlights the corresponding ring segments and clicking on a list item sets
a new root for the diagram. To create a new object set, you can choose from the actions in the context menu, both on the ring segments
as well as on the list items.
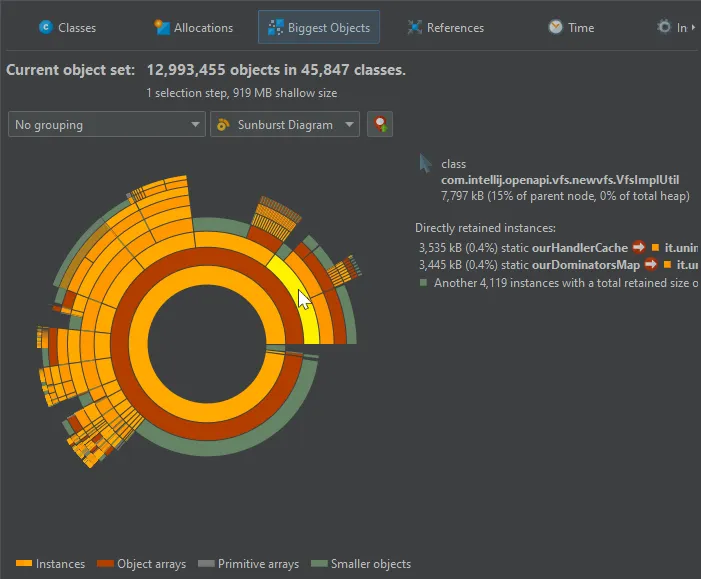
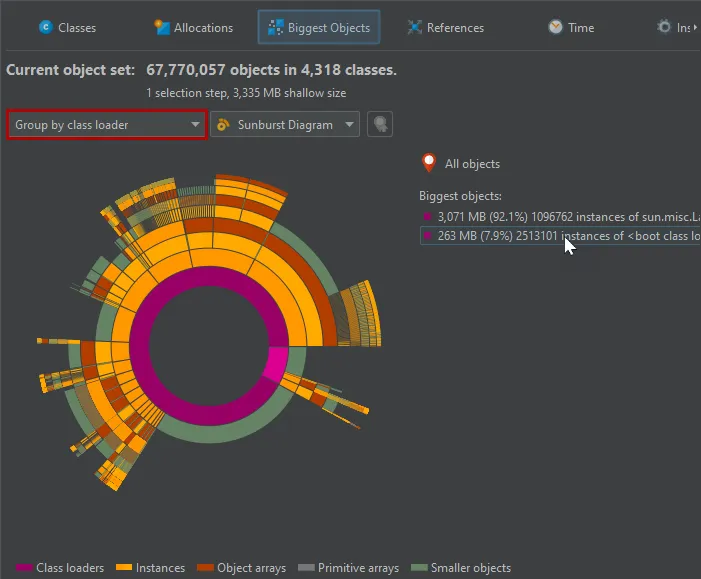
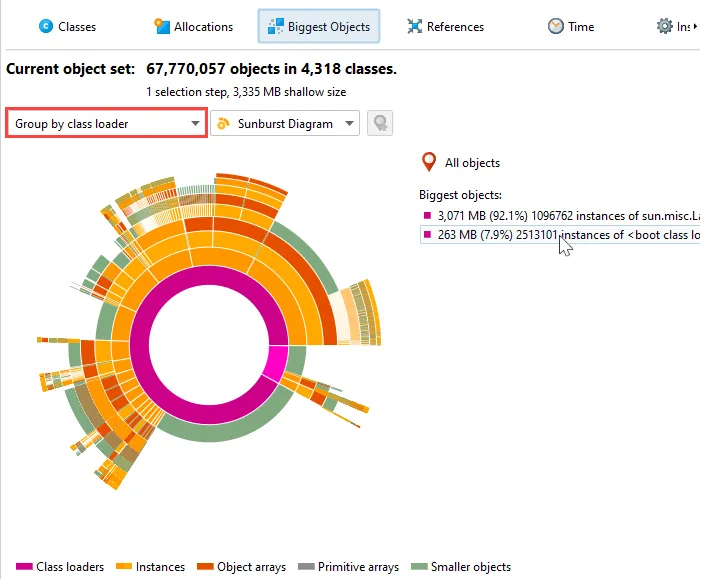
As for the tree view mode, you can group the analysis by class loaders. The class loaders will be shown in the innermost ring.
An additional grouping mode that can also be combined with class loader grouping is grouping by classes. If selected,
all biggest objects of a particular class at the same reference level are combined into a single node.
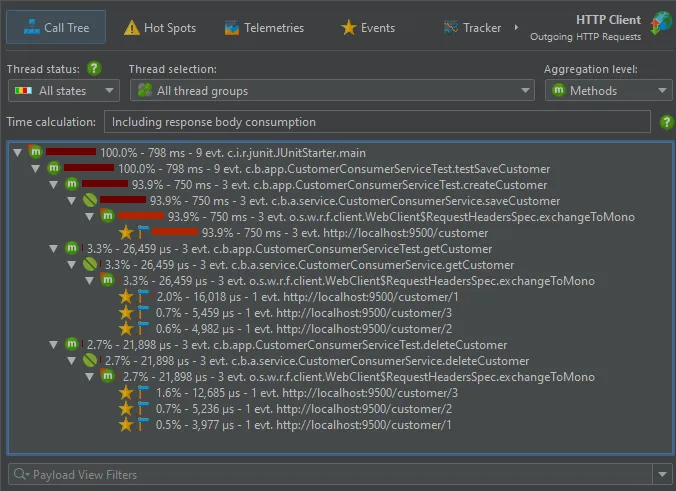
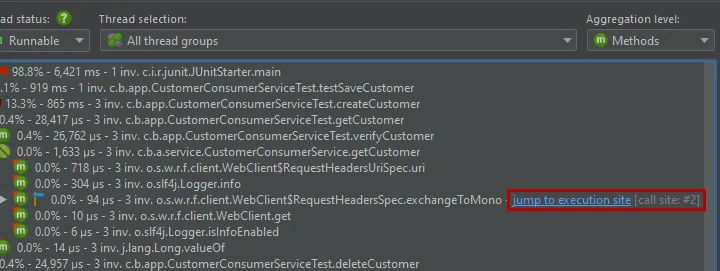
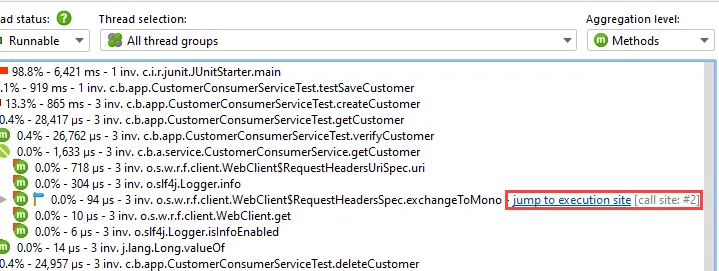
The Reactor Netty web client is now supported for the HTTP client probe.
This goes together with support for the Spring WebFlux HTTP client that uses Reactor Netty under the hood by default.
The Spring WebFlux HTTP client is also supported with the Apache HTTP client.
In addition to the HTTP client probe, the support for the Reactor Netty and Spring WebFlux HTTP clients is important for HTTP tracking
where HTTP call sites are annotated with hyperlinks in the call tree view.
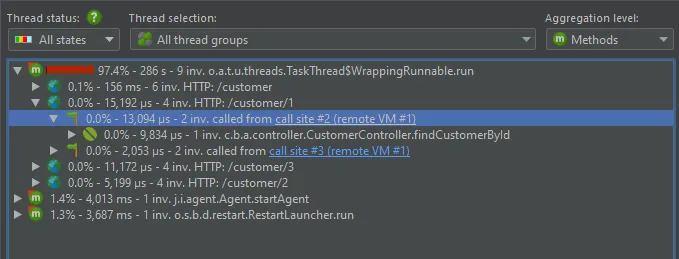
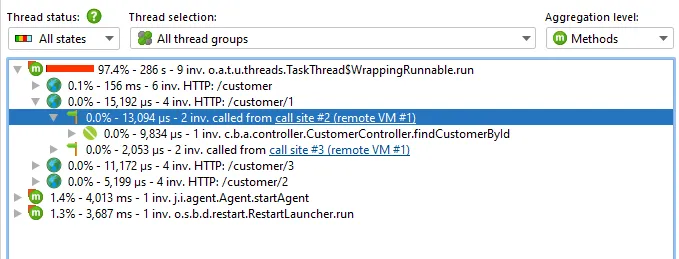
If the server JVM is profiled at the same time in a different JProfiler window, clicking on the hyperlink will show the execution site in that window.
Remote request tracking not only works with live sessions, but also with snapshots.
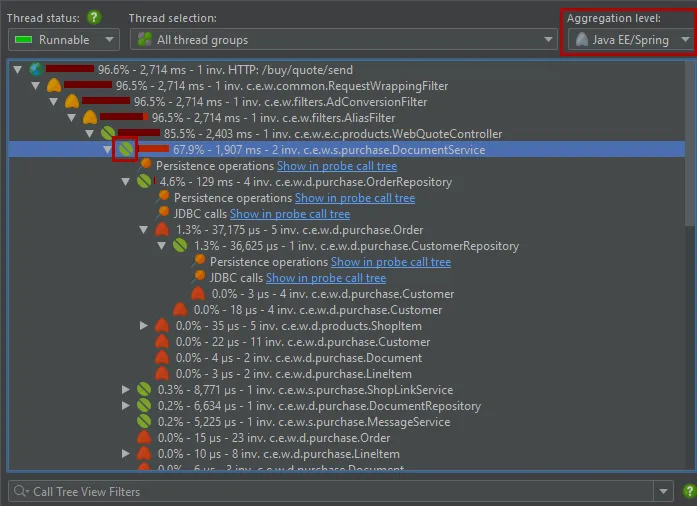
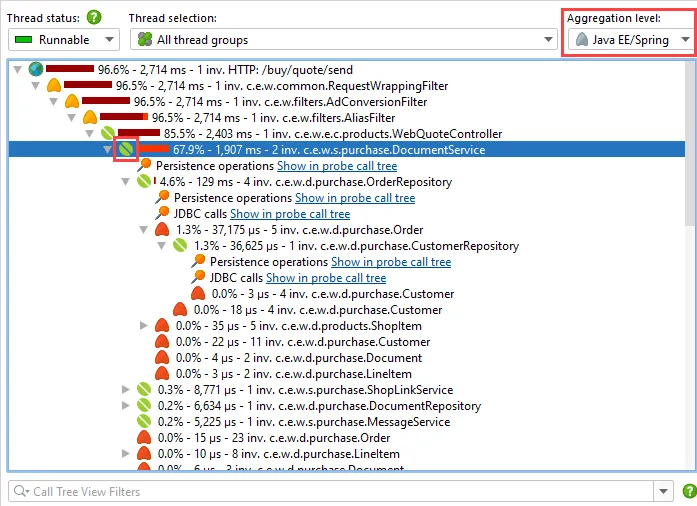
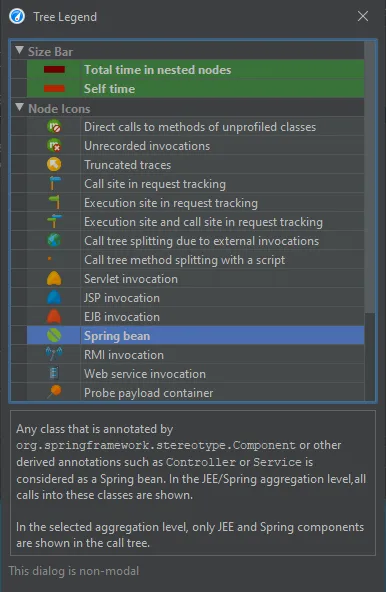
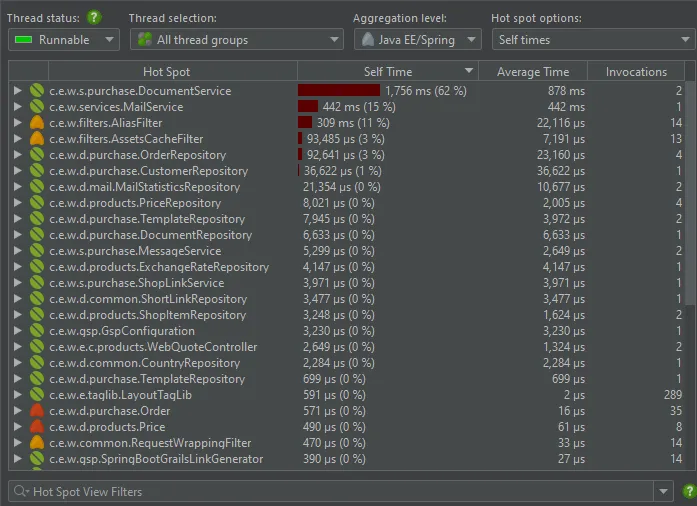
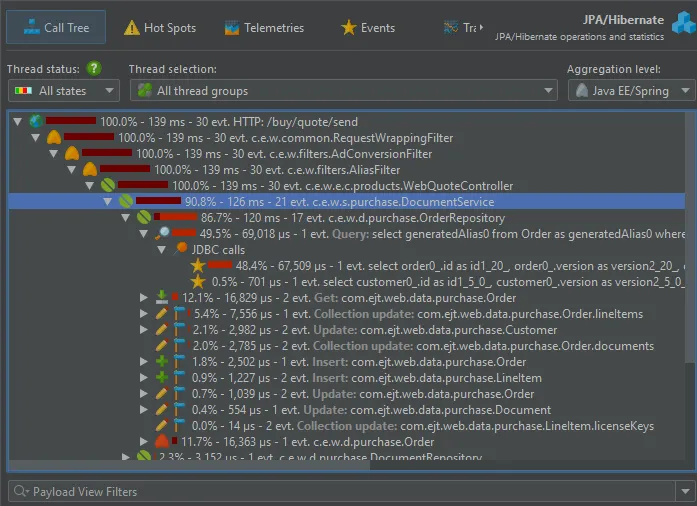
The JEE/Spring aggregation level provides a high-level view for the call tree where only Spring beans and JEE components like
servlets or EJBs are shown. All classes that have been annotated by @Component or any derived annotation like @Service
or @Repository are detected as Spring beans.
JEE and Spring bean nodes are explained in the tree legend dialog that is available from the tool bar in all views that show a call tree.
This aggregation level is especially useful for the hotspots view, where it shows hot spots that are determined not on a per-method basis
but on a per-bean basis. All details of the operations that are performed in other classes and library calls are included in the Spring bean
nodes.
Aggregation levels can not only be selected in call tree views, but also in allocation and probe views.
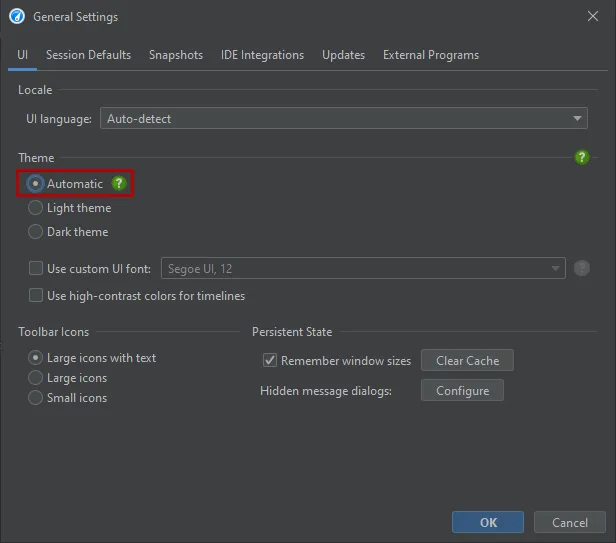
JProfiler now supports live switching between light and dark mode. When the OS theme changes, JProfiler will switch automatically.
In the general settings, it is also possible to select a fixed theme.
Probes in JProfiler now support the following recent releases:
- Hibernate 6
- RestEasy 6
- Ktor 2
- MariaDB connector 3
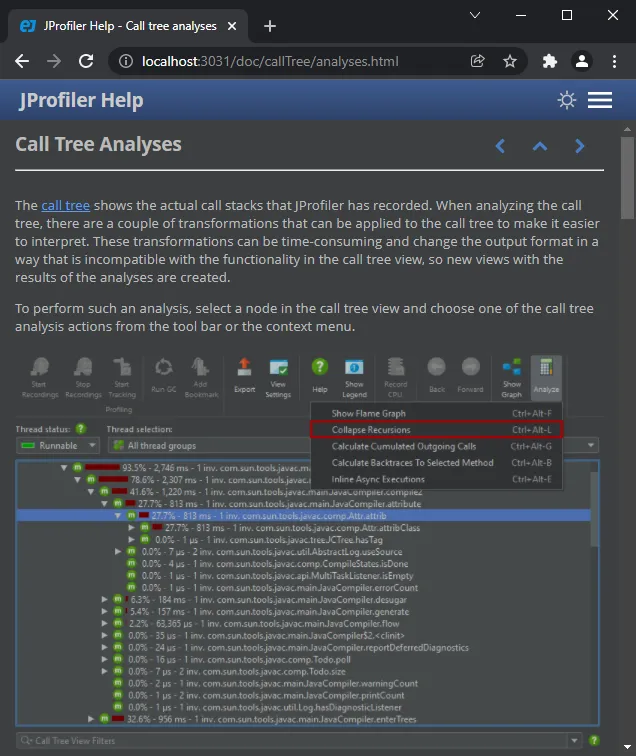
The documentation is now available in dark mode. The default theme follows the OS theme and can be switched manually in the top right
corner.