An async sampling mode without safe-point bias has been added on macOS and Linux. It uses the non-standard AsyncGetCallTrace API in the HotSpot JVM to get call stacks at arbitrary times and not only at certain execution states that the JVM considers as safe points. This profiling mode produces more accurate CPU data for highly multi-threaded CPU-bound code.
What's new in JProfiler 11.1
Change release:
Please see the change log for a detailed list of changes.
JProfiler 11.1 introduces the following notable new features:
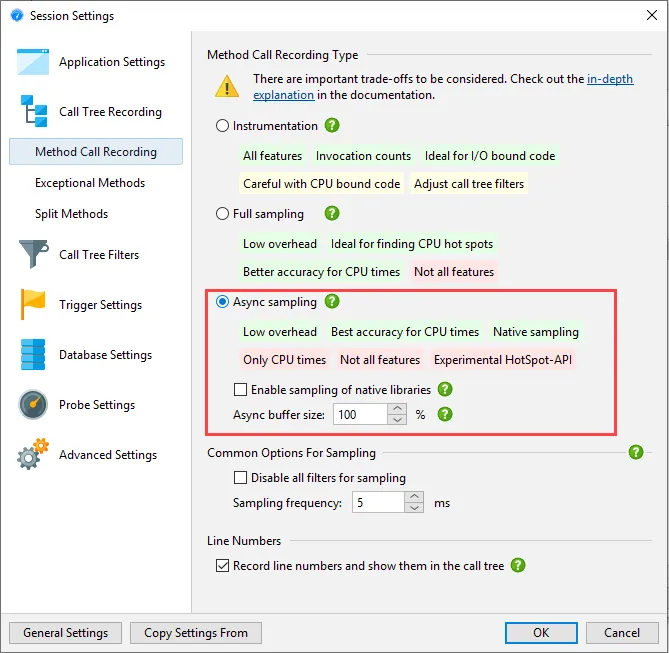
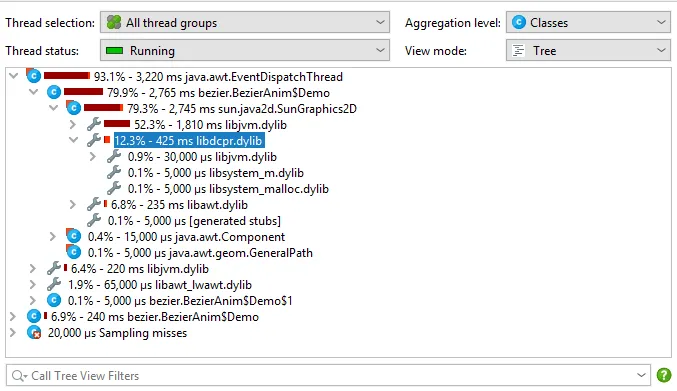
The only thread state that can be measured in this way is "Running". The waiting, blocking and net I/O thread states are not available. Contrary to the other method call recording types that use a "Runnable" thread state to measure when threads are eligible to be scheduled on the CPU, "Running" only measures times where a thread is actually scheduled on the CPU. Obtaining the call stack can fail for a number of reasons which are summarized in the "Sampling misses" top-level node.
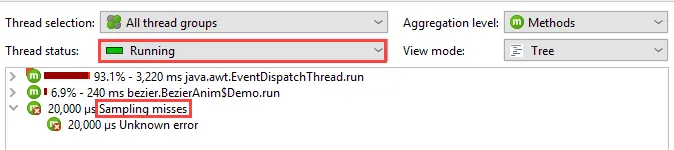
Async sampling uses pre-allocated buffers that may be too small to capture all call stacks. This condition is also shown in the call tree, and the session settings offer a way to increase the buffer size relative to the default size.
Note that Windows does not have signal handlers and does not support this kind of data collection.
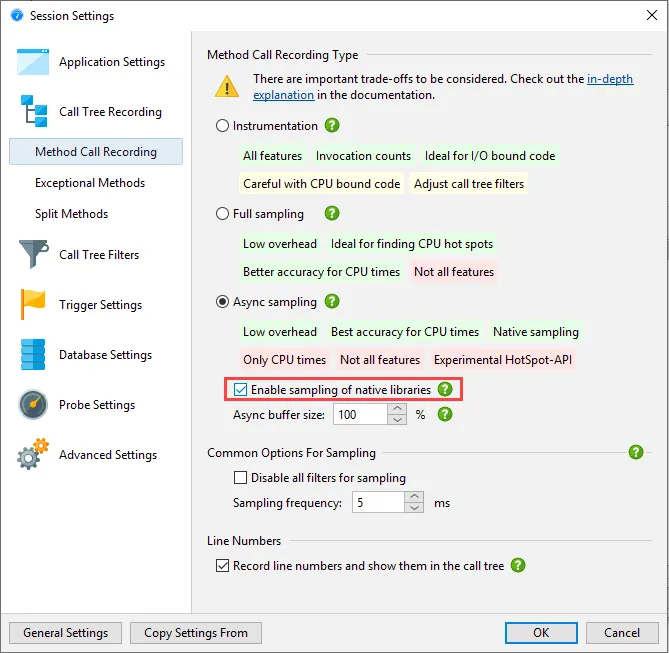
Native sampling has been added on macOS and Linux. When using the new async sampling mode described above, you can optionally enable native sampling. If native sampling is enabled, JProfiler resolves symbols in native libraries and adds native nodes to the call tree.
In native call tree nodes, the associated native library is shown in square brackets followed by the function name.
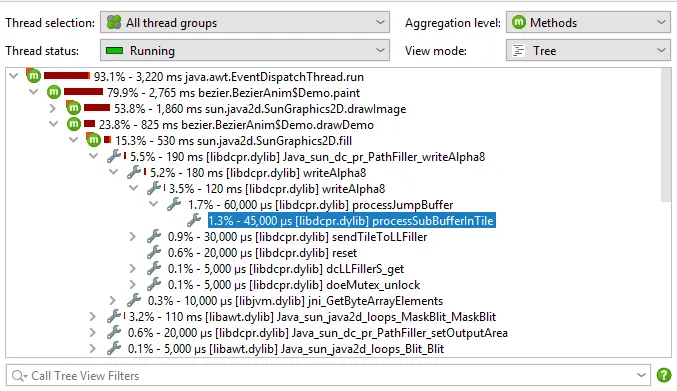
In the classes aggregation mode, native libraries are grouped together, while in the package aggregation level all native calls are cumulated. When removing parts of the call tree, the library also acts like a class, so by removing the class of the selected node (a new feature in this release that is presented below), the entire native library is removed from the call tree.
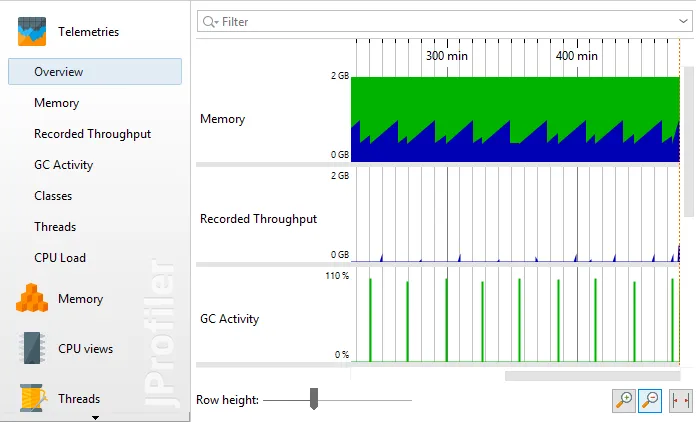
JProfiler can now open JDK flight recorder (JFR) snapshots. JFR snapshots are often recorded in production environments where the installation of profiling agents is restricted. Starting with this release, you can now bring JProfiler's full arsenal of analytic features into play when analyzing these snapshots.
The available views in the view selector are different from those in a regular JProfiler sessions. JProfiler can construct a number of telemetry views from JFR event data including heap size, recorded throughput, GC activity, class loading, thread counts and CPU load.
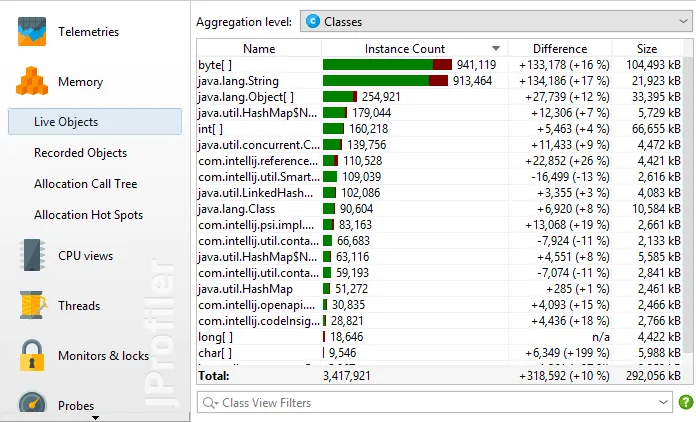
In the memory section, both heap statistics and allocation recording are shown. If heap statistics were enabled for JFR recording, the "Live Objects" view shows the classes that took up most of the heap. The difference between the first and the last heap statistics is shown in the "Difference" column.
Data from allocation recording in JFR snapshots maps to the "Recorded objects", "Allocation Call Tree" and "Allocation Hot Spots" views.
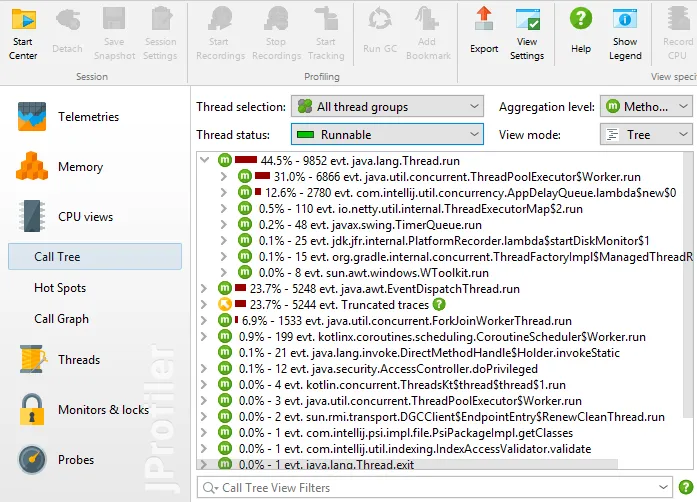
In the CPU section, "Call tree", "Hot Spots" and "Call Graph" views are available. JFR recording truncates traces depending on buffer sizes, those traces are contained in a separate top-level node.
JFR recording only records threads that are runnable and in Java code. Due to the nature of JFR sampling, no time calculation is possible and only event counts are displayed. The "Waiting", "Blocking" and "Socket and file I/O" thread states show times because they are assembled from timed events.
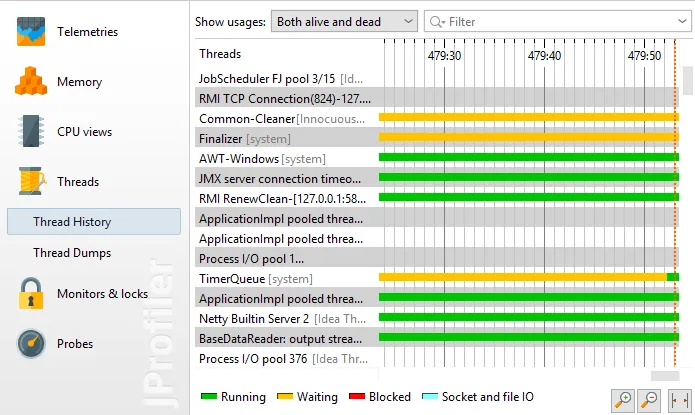
JFR snapshots contain thread data that JProfiler uses to build the thread history view. The contained thread dumps are also displayed in JProfiler.
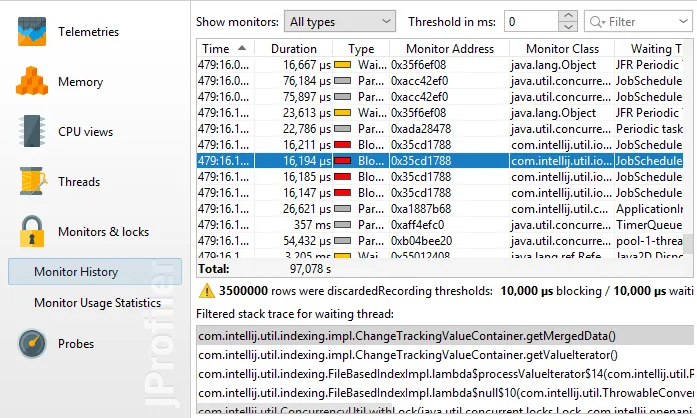
"Waiting", "Blocking" and "Parking" events from JFR snapshots are shown in the "Monitor History" view in the "Monitors & Locks" section. These events are the sources of the "Waiting" and "Blocked" thread states in the CPU views. The "Monitor Usage Statistics" view is also available.
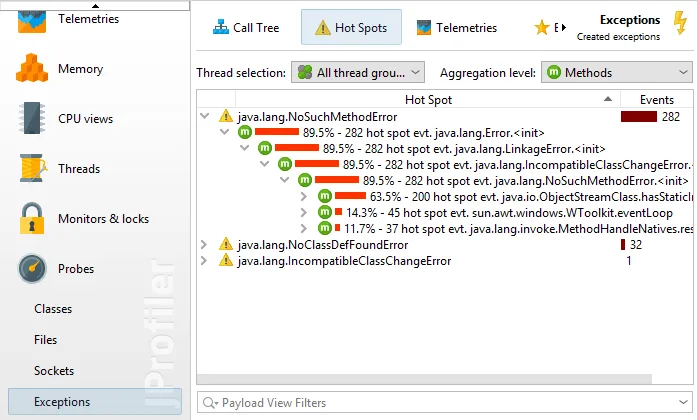
Finally, a number of probes are built from JFR events: "Classes", "Files", "Sockets" and "Exceptions". These views show data depending on whether the corresponding JFR events were recorded. The "Files" and "Sockets" probes are also the source of the "Socket and file IO" thread state in the CPU views.
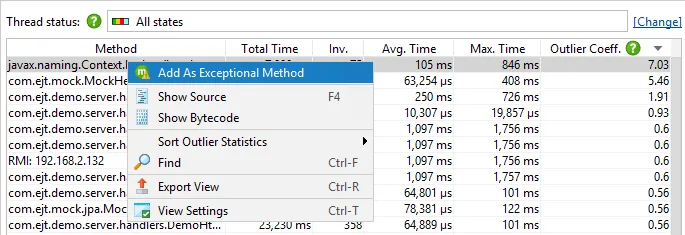
The new outlier detection view shows how the invocation times of methods vary with respect to their average. Data for this view is always available when instrumentation is used for method call recording and CPU recording is active. It replaces the "Method statistics" view which had a separate recording that added a lot of overhead.
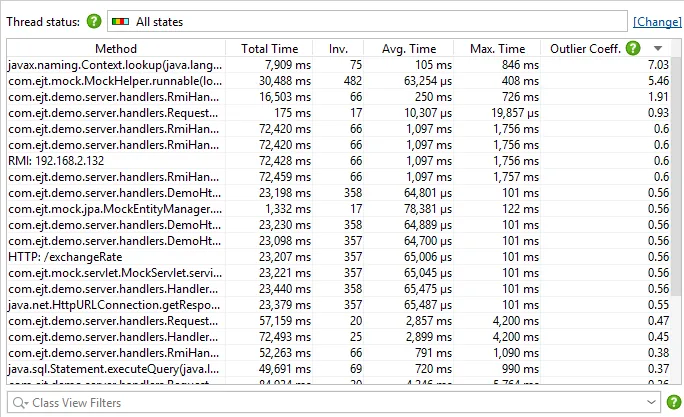
The outlier coefficient quantifies how much the maximum invocation times deviates from the average. Methods with a high outlier coefficient are good candidates for inspection with the exceptional method run recording feature in JProfiler that shows you their slowest invocations separately in the call tree. Also, time measurements for outlier detection are performed for the same selected thread state as for exceptional method run recording.
From the outlier detection view, you can easily select a method as an exceptional method in the context menu.
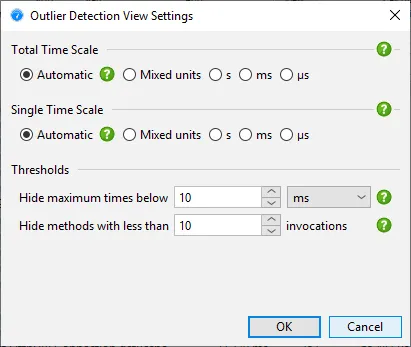
Thresholds for maximum times and invocation counts limit the amount of displayed data and can be adjusted in the view settings.
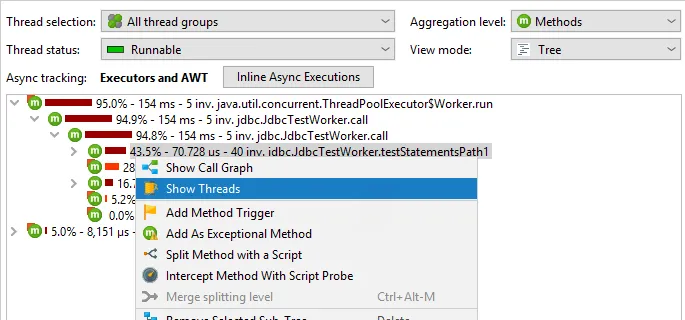
Tracking of async calls now works with sampling, including the new async sampling mode. Previously, you had to profile with instrumentation to use the "Inline async executions" call tree analysis. Having to change the profiling mode to get inlined call stacks proved limiting, particularly for Kotlin coroutines, where inlining is especially important.
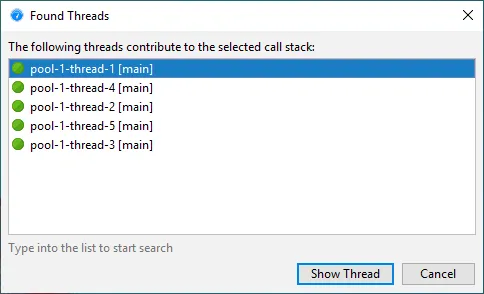
In the call tree you can now show all threads that contribute to the selected call stack. When looking at the call tree cumulated for all threads, it can be interesting to know which single threads are responsible for adding time to the selected node. The context menu gives you access to this action.
From the list of threads you can directly switch to a selected thread in the call tree.
Call tree removal for entire classes or packages has been implemented. You can remove parts of the call tree by selecting a node and choosing the "Remove selected subtree" action.
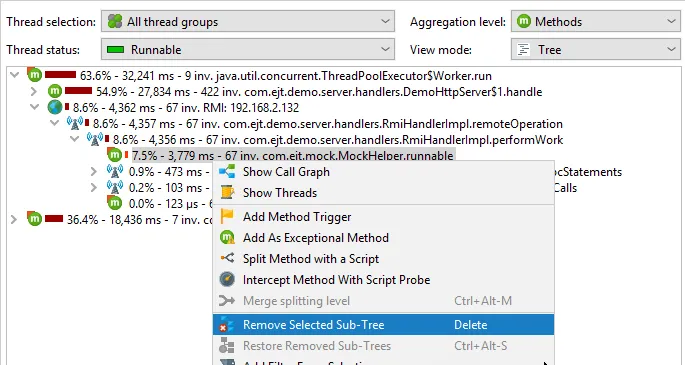
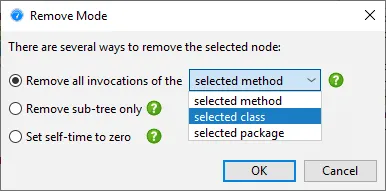
In addition to just removing the selected method, you can now choose to remove all invocations of the selected class or the selected package.
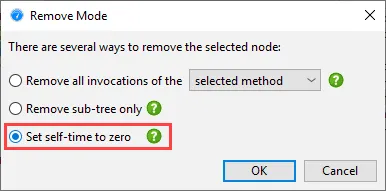
In some situations, you may want to keep the selected method, but just set its self-time to zero. For example, this can be the case for the Thread.run top-level method where most of its self-time is in non-profiled classes and you want the percentages of the profiled code to add up to 100%.
Telemetry drawing has been improved. When telemetries are zoomed out they now show the minimum and maximum envelopes of jittery graphs instead of the interpolated average for each pixel. Also, peaks are preserved for all zoom levels.
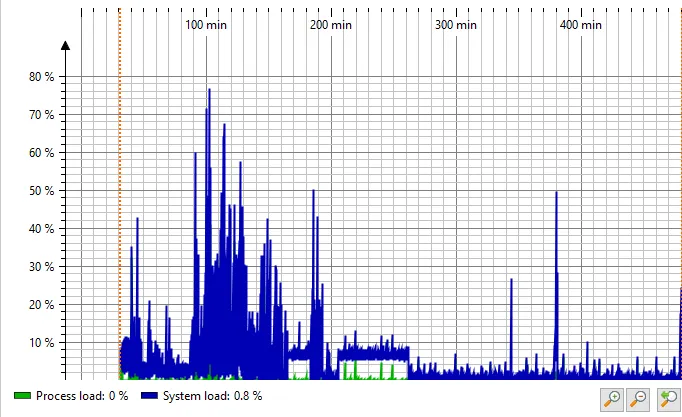
In addition, you can now zoom in and out with CTRL + scroll wheel or pinch gestures on macOS, and telemetries will preserve the current cursor position when zoom levels are changed.