Zero-configuration remote attach via SSH. Until now, profiling a JVM on a remote machine required the installation of an agent and preparation of the remote JVM. Not so anymore. Just with SSH credentials you can now connect to a remote Linux, Solaris or macOS machine and select from a list of running JVMs.
What's new in JProfiler 10.0
Change release:
Please see the change log for a detailed list of changes.
JProfiler 10.0 introduces the following notable new features:
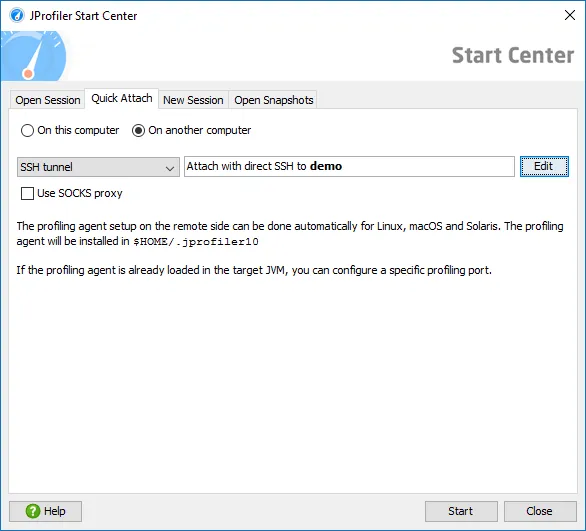
SSH connections are made directly by JProfiler, you don't have to set up the SSH tunnel yourself. It's even possible to configure multi-hop tunnels.
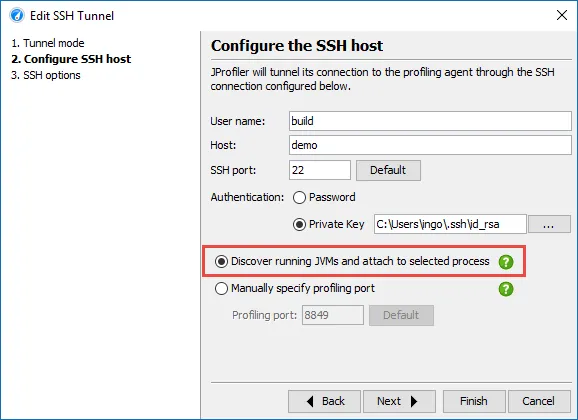
JProfiler will automatically download the required agent package, upload it to the remote machine and use its command line tools to gather the information that you see in the attach dialog. The agent package is cached, so this is only done once.
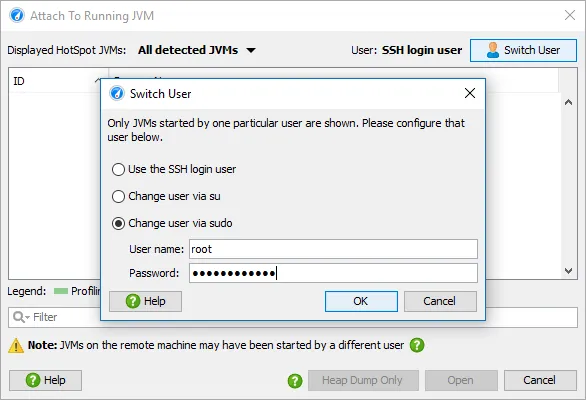
Because you have to authenticate as the same user that has started the JVM that you want to profile, it is possible to switch the user for the remote attach. For example, you can sudo to the root user to attach to a service that was started as root.
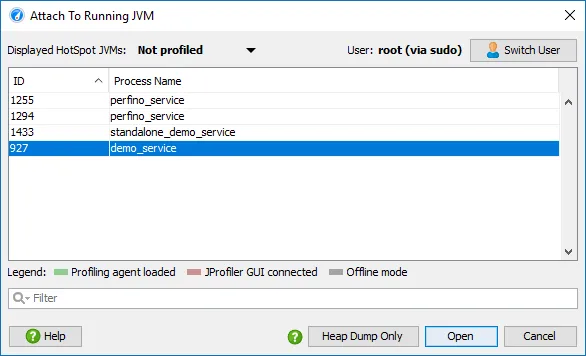
All the JVMs started by the selected user are shown, and you can either start a full profiling session or just take a low-overhead HPROF heap dump and open it in JProfiler.
Improved local attach to Windows services. Apart from the new remote attach features, local attach has been improved as well. On Windows, it is now possible to attach to services that are not started by the LocalSystem account. JProfiler can now attach to all services, started by admin and non-admin users.
Complexity analysis for selected methods. A new CPU view allows you to analyze algorithmic complexities. More generally, you can investigate how execution times of selected methods depend on their method parameters from a statistical viewpoint.
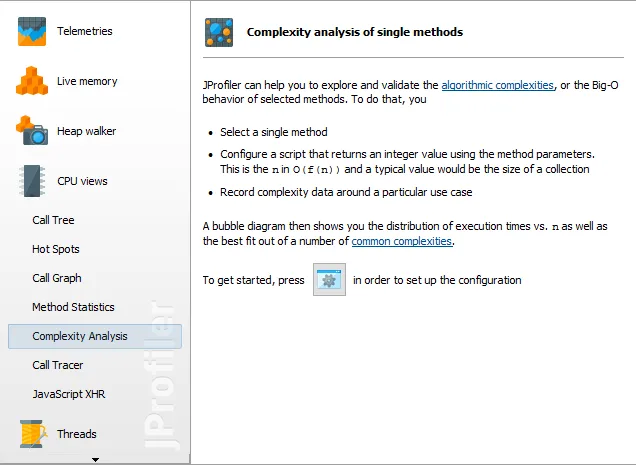
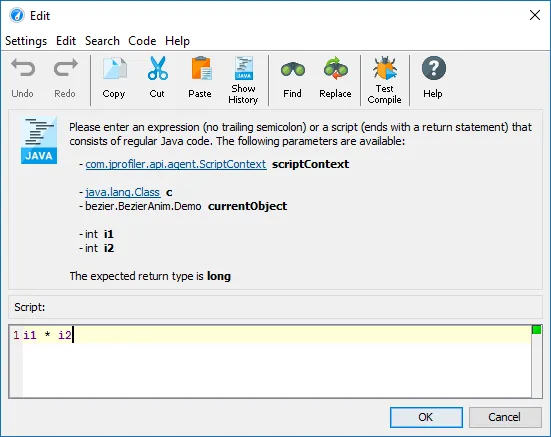
The only thing you have to do is to select a method and enter a script that determines the complexity of an operation as a positive numeric value.
After recording complexity data, the recorded execution times will be plotted against the associated complexity values. A number of common Big-O complexity curves will be fitted into the data and the best fit will be selected.
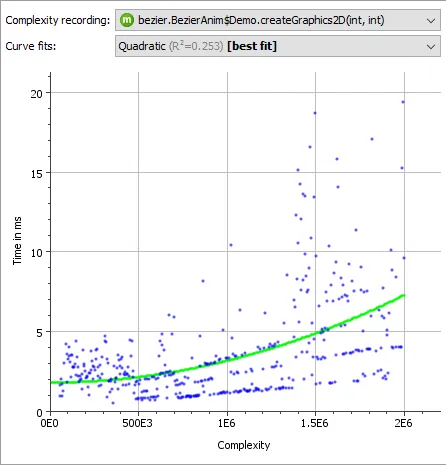
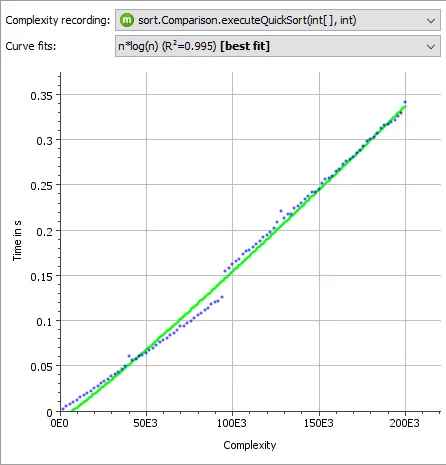
The spread of the measurements around the fitted relation depends on how much the result times actually depend on the calculated complexity and whether there are other factors in play. Below you see the result for a quick-sort implementation that shows the expected n*log(n) behavior, however with some deviations from the mathematical model.
"Show classes" analysis in the allocation tree. In the allocation tree view as well as the allocation hot spots view in the live memory section, you can now analyze which classes have been allocated in a particular allocation spot. This kind of operation was previously only available in the heap walker.
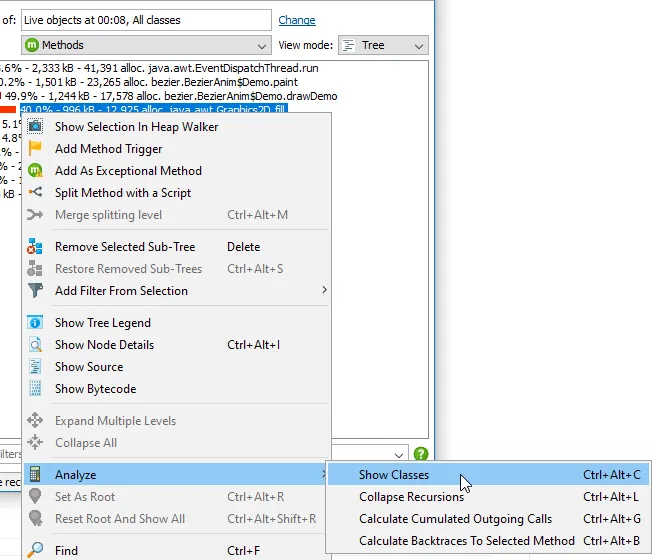
A tabular view showing all allocated classes together with their instance counts will be shown as a call tree analysis below the main view.
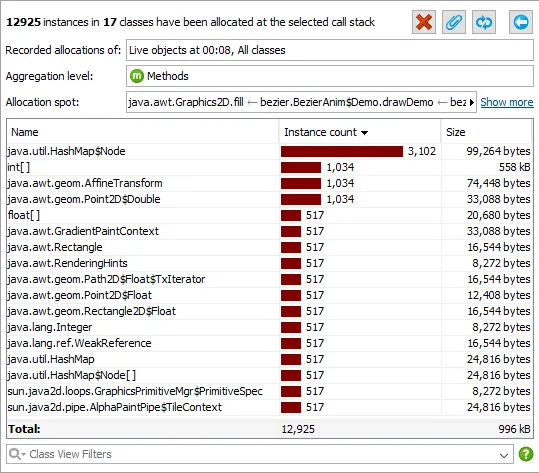
In addition, the call tree analyses views are now more manageable. The header now shows the time when the data for the call tree analysis was collected. You can pin a view so another call tree analysis of the same type does not overwrite it. Also, you can close or recalculate a call tree analysis.
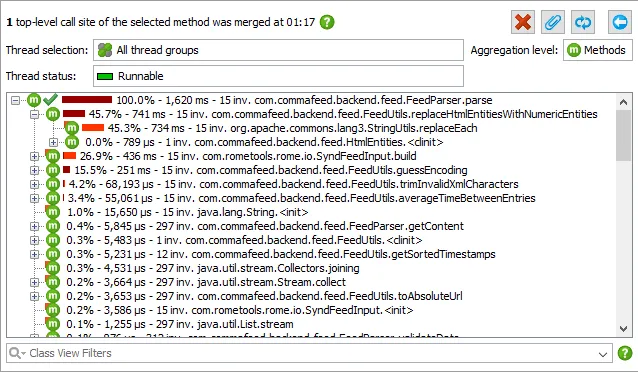
Call tree analyses in the call graph. With the "Cumulated outgoing calls" and "Backtraces" analyses in the call graph it is now possible to switch back to tree-representations from any call graph node.
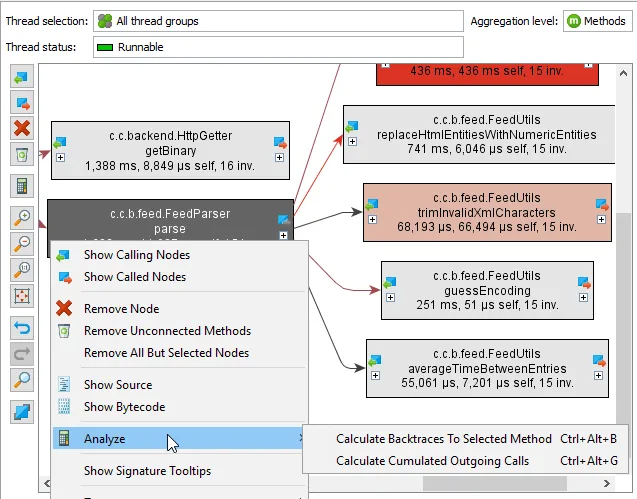
The results of the call tree analyses are shown as nested views below the call graph. Their data is based on the graph data and does not change until you calculate a new call graph.
See new objects in the heap walker. The heap walker now knows which objects are new since the last time a heap dump has been taken or the "Mark heap" action has been executed.
The new "Mark heap" action is advertised on the heap walker start page and is also available in the API, the JProfiler MBean and as a trigger action.
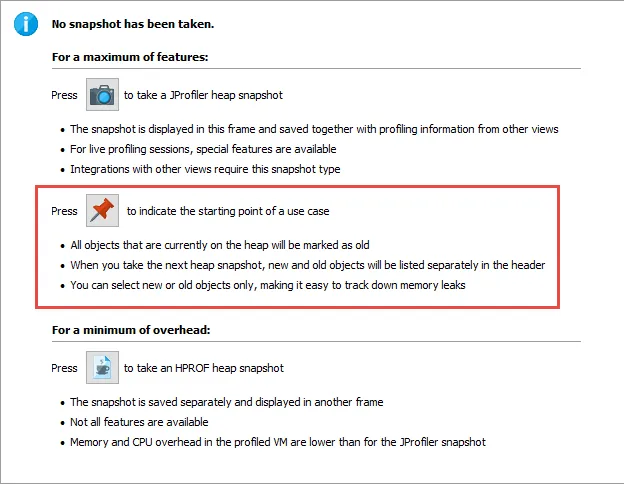
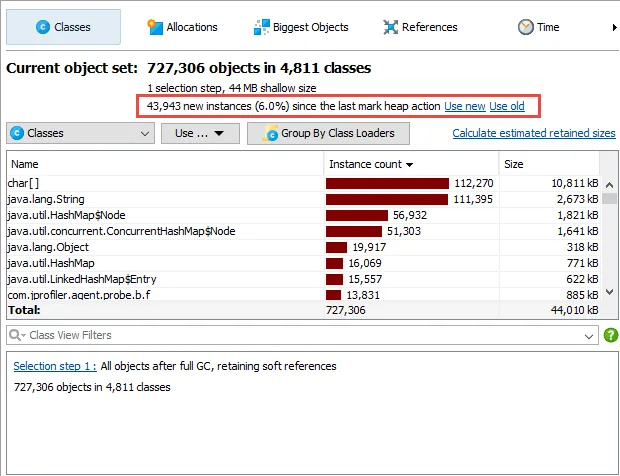
The header of the heap walker displays how many objects in the current object set are new. There are actions for selecting only the new objects or only the old objects.
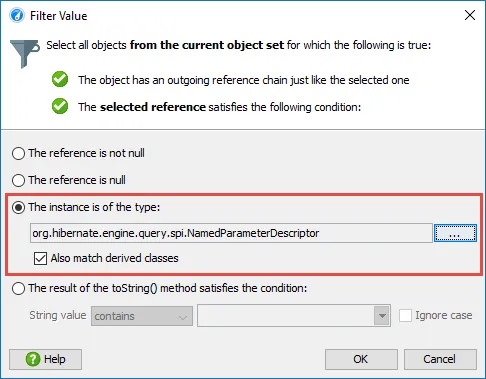
A type filter has been added to the reference views in the heap walker. In the incoming and outgoing reference views the "Apply filter by restricting the selected value" action now offers an option to filter by the type of the selected value.
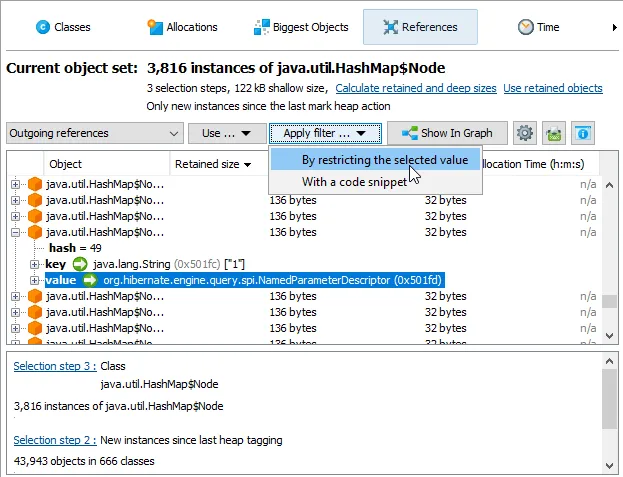
In addition to exact matching, it is also possible to match all derived classes.
Save snapshot on exit functionality has been added to JProfiler. In the session startup dialog, there is now a "JVM exit action" drop-down that contains an option to save a temporary snapshot when the JVM exits and immediately open it in JProfiler.
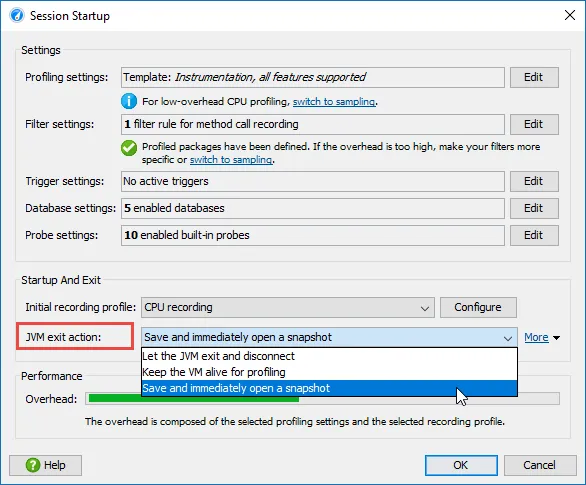
For such a snapshot, the "Save" button in the tool bar will remain active, so you can save it to a permanent location. If you close the JProfiler window, the snapshot will be discarded.
In addition to this new option, the option to keep the VM alive that was previously found in the profiling settings is now also available in the session startup dialog.
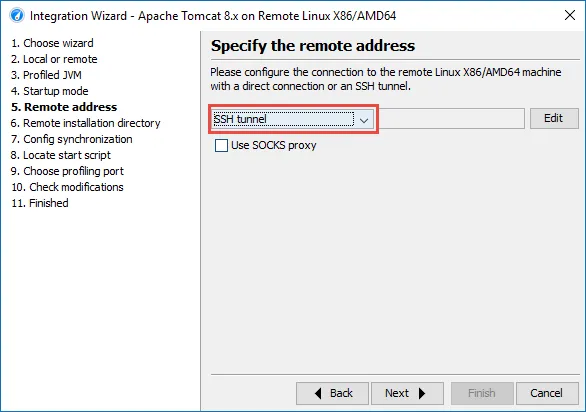
Remote integration wizards have been improved.
They now support SSH connections.
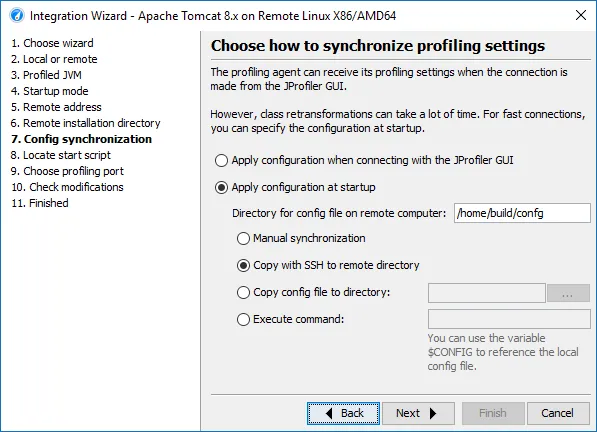
If you select the "Startup immediately" option, you can now always configure config file synchronization to the remote machine in order to reduce the overhead at connection time.
With SSH connections, this synchronization is most convenient, because the config file can simply be copied to the remote location. Each time you modify the profiling settings, the synchronization will be performed.
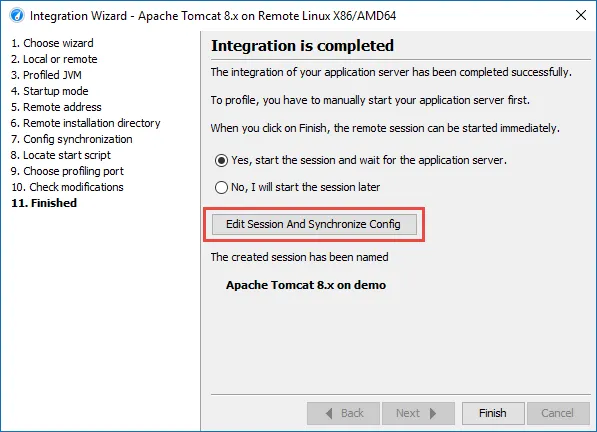
At the end of the wizard, you now have a chance to edit the created session and trigger the synchronization immediately.
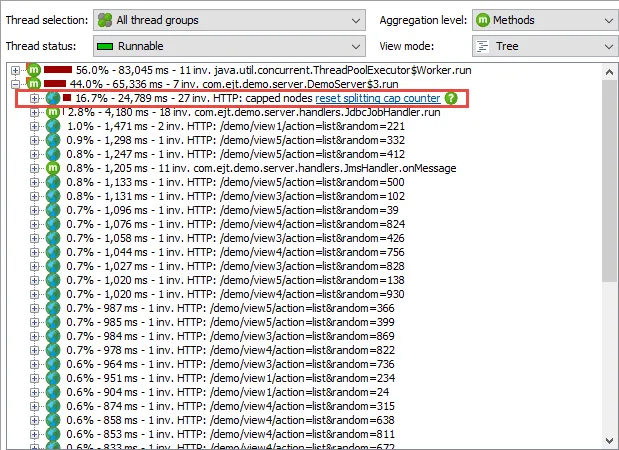
JProfiler now has a configurable cap on the number of call tree splits. Splitting the call tree in JProfiler can produce extremely broad call trees if the splitting condition is too fine-grained. This can lead to unacceptable memory consumption or CPU overhead.
In the call tree of a live session, splitting nodes are consolidated into a split-specific node named "capped nodes". Next to the that node you find a hyperlink that allows you to reset the splitting counter so you can continue to see splits from newly profiled use cases.
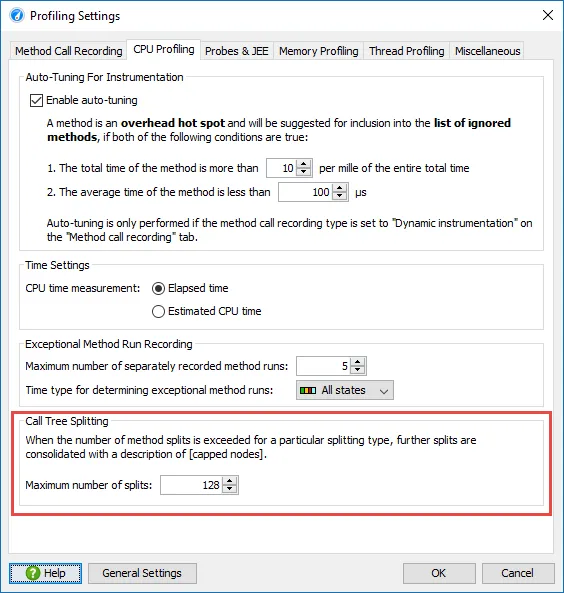
In the profiling settings you can permanently adjust the maximum number of recorded splits for a session.
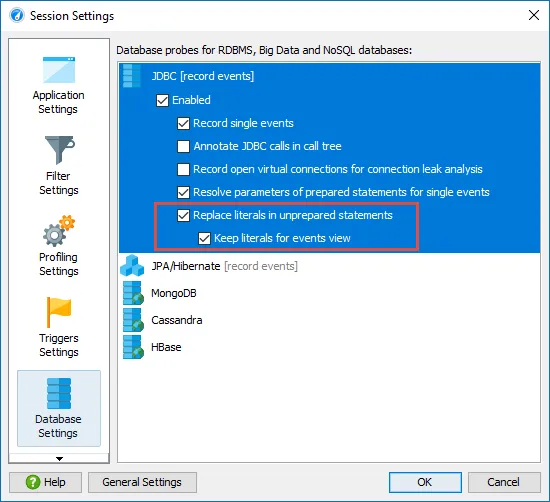
Improved handling of unprepared statements in the JDBC probe. Unprepared statements are bad for calculating hot spots, because IDs or other parameters in the SQL statements make each SQL statement unique.
In JProfiler 10, the JDBC probe has an option to parse and remove literals from SQL statements. There is a separate option to keep the full SQL statements in the events view for debugging purposes.
Major improvements in the IntelliJ IDEA plugin.
Source code navigation has been improved: JProfiler can now precisely find lambda methods for Java 8 and full source code navigation support for Kotlin has been added.
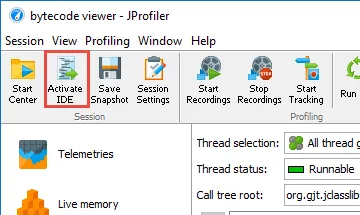
Window foreground activation has been made reliable in both directions, so JProfiler and IDEA work together seamlessly even though they are two separate processes. The JProfiler window now has an "Activate IDE" button in the tool bar when started from the IDE integration.
Profiling sessions that are started through the IDEA plugin now have their own tool window that contains an action to switch to the JProfiler window.
The tool window in the IDE also has actions that control recording in JProfiler as well as an action to overlay a CPU graph onto Java and Kotlin source code.
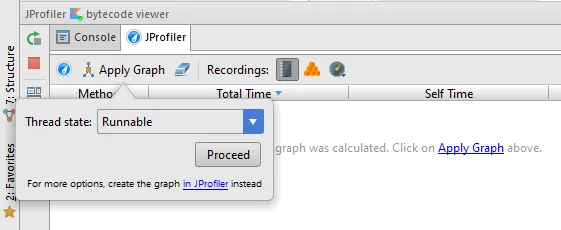
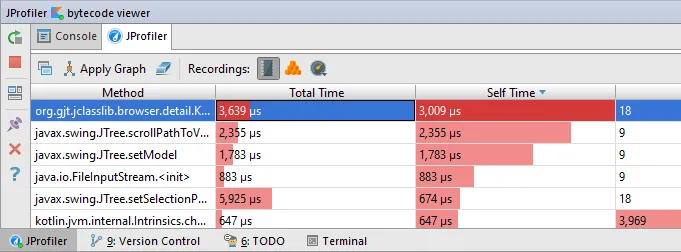
CPU graphs can be calculated in the IDE or in the call graph view in JProfiler - in both cases the JProfiler tool window shows a list of hot spots and the gutters of source editors show icons for incoming and outgoing calls.
The list of hot spots provides you with with entry points to start your analysis, by double-clicking on the table rows you navigate to the corresponding methods.
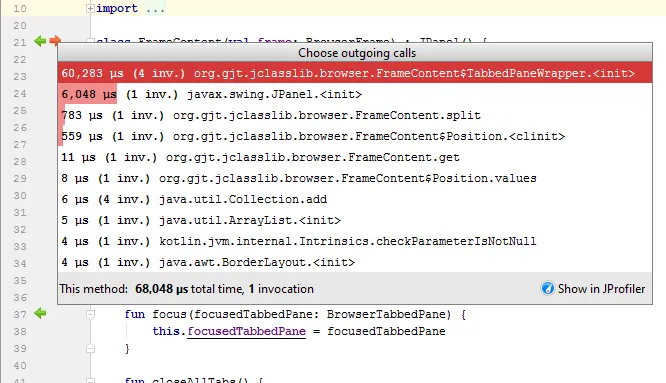
The gutter icons show tool tips, and when you click on them, popups with inline graphs show the distribution of incoming and outgoing calls. Clicking on the methods navigates to them, and you can jump along call chains in that way.
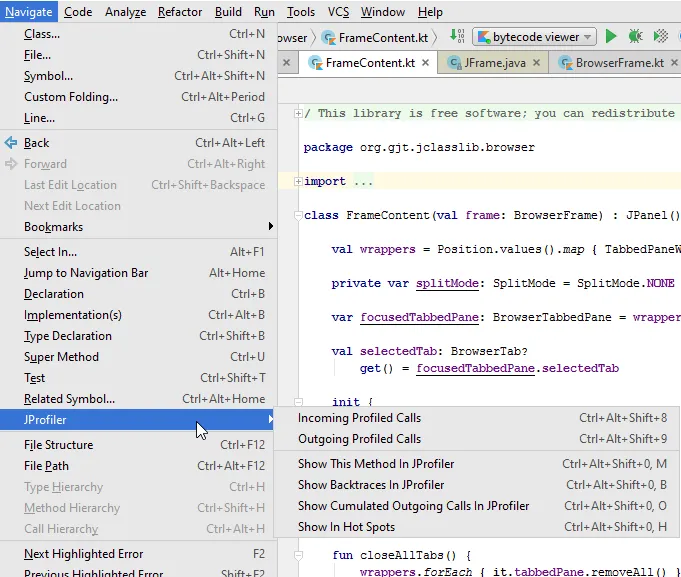
The "Show in JProfiler" button leads back into the call graph view in JProfiler. You can either show the selected method node in the call graph, or show the associated call tree analysis - "cumulated outgoing calls" for the outgoing calls and "backtraces" for the incoming calls. In that way you can easily switch from the source-based call graph analysis in the IDE to the visually more compact call trees in JProfiler.
All navigation actions have configurable keyboard shortcuts and are collected in the "Navigate->JProfiler" submenu.
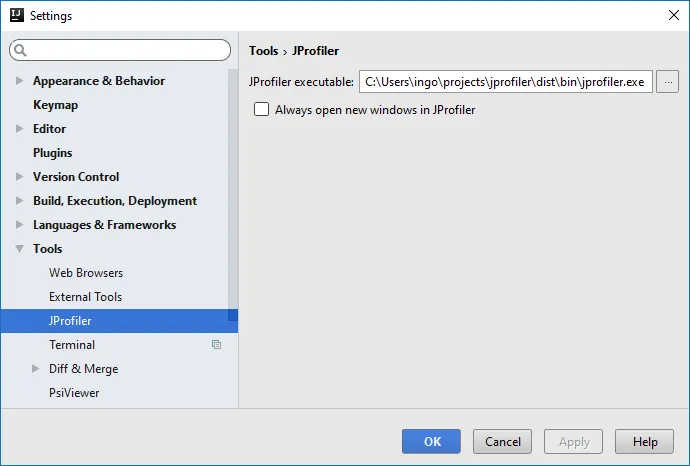
JProfiler now has a settings panel where you can configure the JProfiler installation location and whether you always want to open new windows when profiling. The default is to reuse JProfiler windows unless they are blocked by a live session.
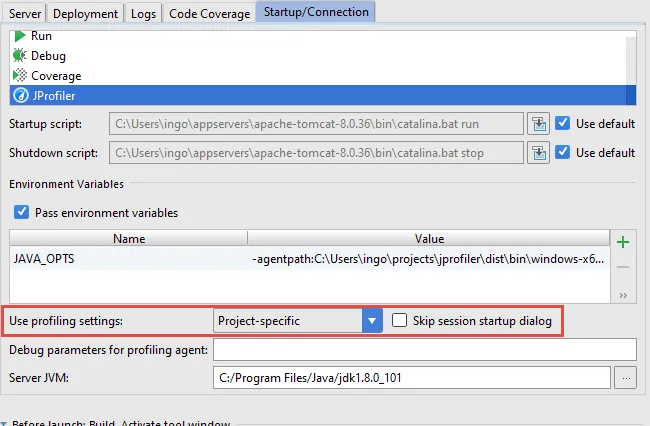
Profiling settings are now stored on a per-project basis. To revert to the per-run-configuration setting, you can choose the corresponding option in the "Startup/Connection" tab of the run configuration dialog. There is now also an option for skipping the session startup dialog. In that way, profiling does not require an additional click as compared to running or debugging the session.
Run configurations for tests now save a snapshot on exit by default, so it is no longer necessary to modify profiling settings for each run configuration in order to view profiling data.
Final support for Java 9. While we have tracked the evolving state of the new module system in Java 9 over the past JProfiler releases, the final feature set of Java 9 is now expected to remain stable. JProfiler 10 fully supports the latest builds of Java 9 and is expected to support the final release as well.