Category: jprofiler

Tracking JavaScript calls into your Java backend

This screen cast shows how to split your Java call tree for different JavaScript XHR calls. By installing the JProfiler Chrome plugin, a locally running JProfiler GUI will be notified of XHR calls in the browser and show an event description and a stack trace without further configuration. In this way, you can identify the sources of your CPU load beyond the granularity of your URLs and analyze the call tree in isolation for specific browser events.
Java profiling across JVM boundaries

This screen cast shows “Remote request tracking” in JProfiler. It makes it possible to profile business transactions that span multiple JVMs. Here, a web service call to another JVM is shown and profiled in isolation of other requests that are handled by the server. In addition, JProfiler supports remote request tracking for RMI and remote EJB calls.

Profiling MongoDB

This screen cast shows how to use the MongoDB probe in JProfiler that has been added in JProfiler 8.0. The profiled application is the vert.x web demo application that uses mongodb as a storage option. MongoDB events are correlated to the the activity in the web application and it is shown how the exclusion of primitive data leads to a useful definition of hots spots.

Attaching to Windows services for Java profiling

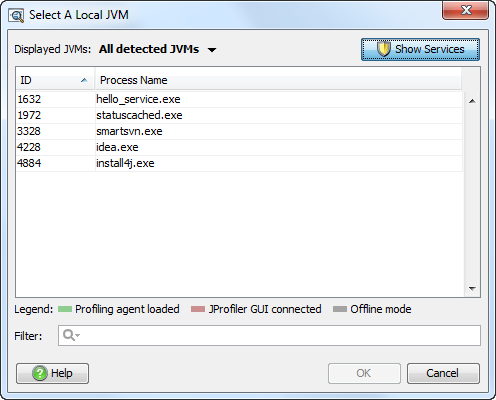
Several profilers can attach to running JVMs, but only JProfiler can attach to Windows services. It is very easy to do:

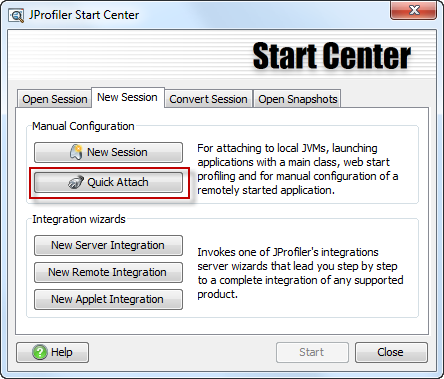
1.Start “Quick attach”:

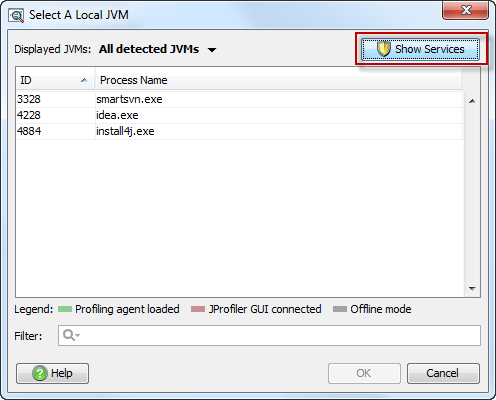
2. All JVMs are shown that run with your user account. Select the “Show services” button at the top:

 3. Select your service:
4. Profile!

Using the probe tracker

This screen cast shows how the probe tracker can be used to record fine-grained chronological information for selected hot spots and control objects, such as JDBC connections. The probe tracker is available for all probes in JProfiler.

Profiling JPA/Hibernate

The screen cast below shows the capabilities of the JPA/Hibernate probe in JProfiler. It presents the events view of the probe that shows a chronological progression of persistence operations as well as the hot spots view that shows back traces and associated JDBC statements.

Profiling with IntelliJ IDEA 11

As always, we try to provide an IntelliJ IDEA plugin immediately when a new major version of IDEA is released.

Most of the time, a release of IDEA does not coincide with a JProfiler release, so we release the plugin separately in the plugin manager. To install the JProfiler plugin in IDEA (both community and ultimate editions), click on “Browse repositories” in the plugin manager and look for “JProfiler”.

The plugin will be bundled in the upcoming JProfiler 7.1 release.

Update (2012-01-16): By mistake, the plugin version (different from the JProfiler version) decreased from 10.3 to 10.2, so many update problems were caused by this. Now the plugin version has been increased to 11.0 and the update should work if you had 10.2 or 10.3 installed previously.

Java profiling comes to Linux ARM

Up to now, there was no good solution for profiling Java code on embedded systems. With the 7.0.1 release of JProfiler, we have introduced support for the Linux ARM platform. The native agent libraries in the bin/linux-arm directory work with the official Java SE for embedded from Oracle.

On the embedded device, you just add the VM parameter -agentpath:[path to libjprofilerti.dll] to the profiled JVM. In the JProfiler GUI on your development machine, you create a session of type “Attach to profiled JVM” to start profiling.

Sampling vs. Instrumentation

Fabian Lange from codecentric has written an excellent article on the differences between sampling and instrumentation.

Sampling and instrumentation are the two modes how methods are measured for CPU profiling. Both have advantages and disadvantages and it depends on the use case which is better for you.

This decision is already prominently featured in JProfiler when you start a new session for the first time, as shown in this screen cast.