perfino is now free for development with a single VM and 24 hours of historical data.
The free development license and an evaluation license for 20 VMs can be activated directly in the installer after you download perfino.
perfino 2.0 introduces the following notable new features:
perfino is now free for development with a single VM and 24 hours of historical data.
The free development license and an evaluation license for 20 VMs can be activated directly in the installer after you download perfino.
perfino has a new look. New design, new colors, new icons and now also optimized for Retina displays.
An MBean browser has been added. When a single VM is selected in the "VM Data Views", the MBean browser shows the registered MBeans in the JVM, regardless of whether the MBean server has been exported with a JMX connector server or not.
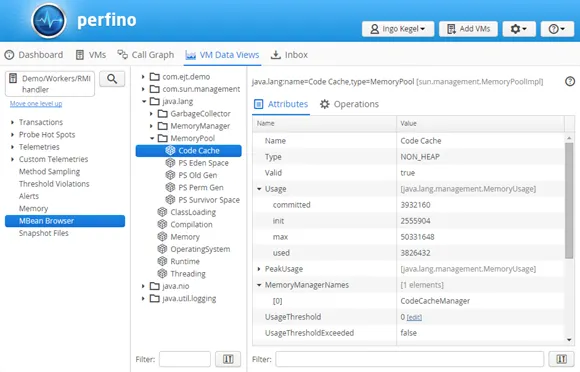
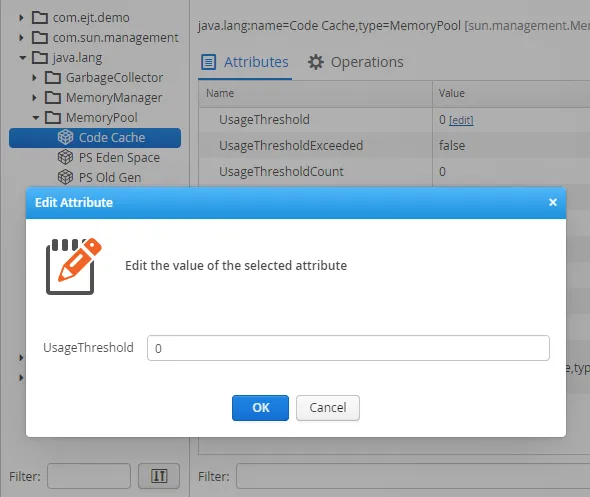
Editable attributes of all simple types and their arrays can be edited by the MBean browser. The default MBeans in the JVM already expose a lot of interesting diagnostic options. Many frameworks and most application servers can be configured with their MBeans.
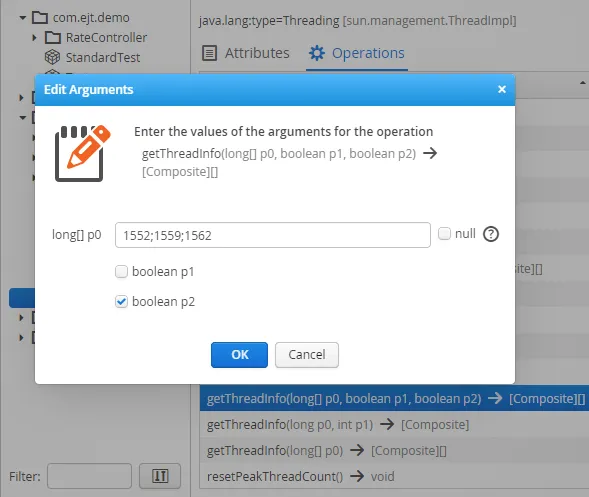
MBeans also expose operations, for example, to control life-cycle aspects of an application server. MBean operations may have parameters, in which case perfino will ask you for their values.
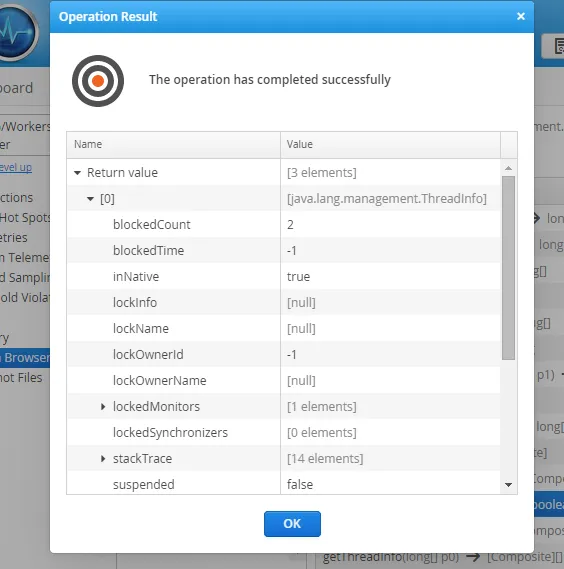
The return value of an operation is displayed in a separate window. In the screen shot below, you can see how perfino combines nested arrays and composite data into the same tree table.
Tabular data with simple keys and single values are displayed inline. This makes it easy to read maps from MXBeans, which are converted into tabular data. In the screen shot below, the system properties from the "Runtime" MXBean are shown.

perfino can now record telemetries based on MBean values. The telemetries are configured in the new "Telemetry" step of the recording settings. Each telemetry can have a number of lines that are shown in the same graph.
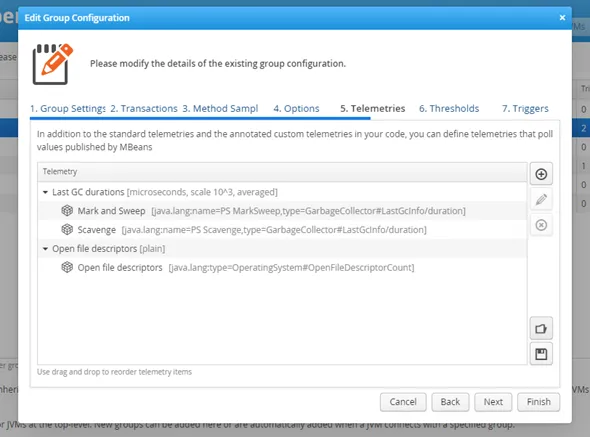
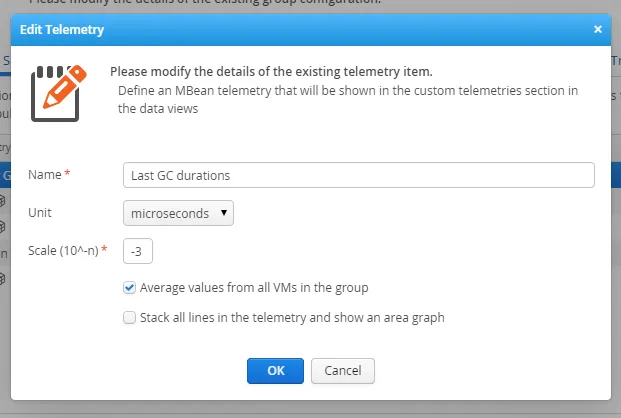
Telemetries can have a unit and optionally a scaling factor. Contained telemetry lines can be stacked, and for multiple VMs, the displayed values can be averaged or summed.
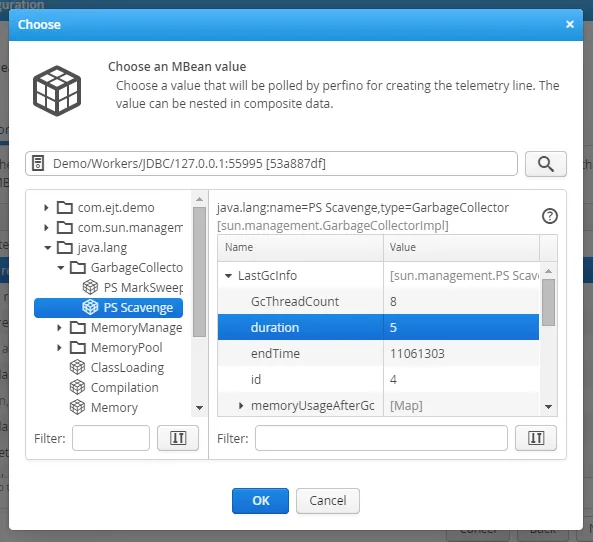
A telemetry line is defined with a caption, an MBean object name and a path to a numeric value. The path can simply be an attribute name or a hierarchical path into a composite or tabular data structure.
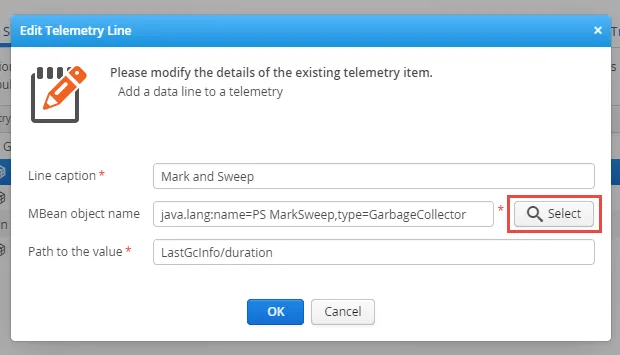
To make it easy to get this configuration data, the "Select" button in the telemetry line configuration dialog brings up an MBean browser that lets you choose the attribute from a connected VM.
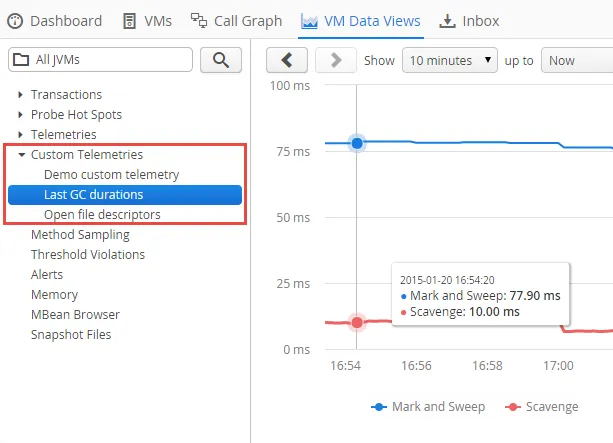
In the "VM Data Views", MBean telemetries are displayed under that the "Custom telemetries" view category node, together with Devops telemetries from annotated static methods. That node only exists if at least one such telemetry is being recorded.
Devops telemetries have been enhanced to match the capabilities of the new MBean telemetries.
The @Telemetry annotation now has a format parameter of type @TelemetryFormat that allows you to set the telemetry unit and scale factor. Also, you can determine whether the telemetry lines should be stacked and whether telemetry values for multiple VMs should be grouped or summed.
A typical usage now looks like
@Telemetry(value = "Job latency",
           format = @TelemetryFormat(value = Unit.MICROSECONDS,
                                     scale = -3))
A REST API for exporting recorded data has been added. In addition to the manual export capabilities in the web frontend, you can start a REST export API service by setting the apiPort property in perfino.properties to a non-zero value.
Supported export formats are plain text (CSV), JSON and XML, depending on the Accept header of the HTTP request.
The API allows you to list groups, VMs, and available telemetry names that serve as input parameters to other export commands. It is possible to export all transaction-related views, probe hot spots, alerts and threshold violations.
For example, if the API is running on port 8500, a call to export the call tree of the recorded business transactions of the last 10 minutes for all VMs in the group "Web", the URL would be
https://localhost:8500/transactions/callTree?group=Web&interval=10min
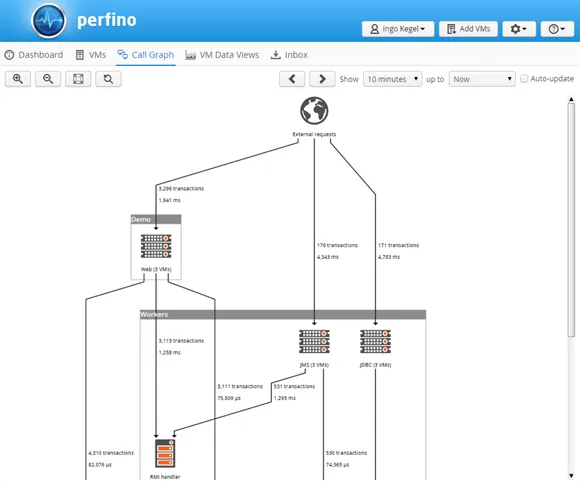
perfino now shows probe data in the dashboard. Many performance problems arise from database issues, so having database operations in the dashboard will give you an immediate idea of whether some operations are misbehaving.
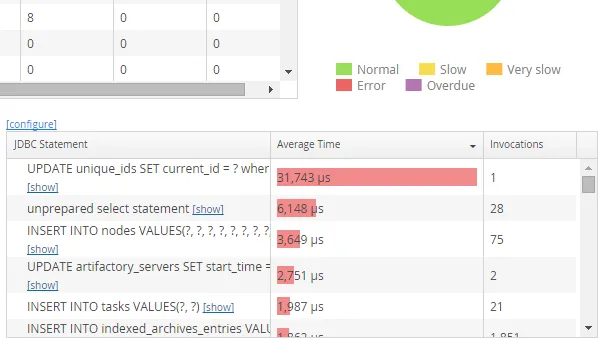
The displayed probe type can be selected with the "Configure" link above the table.