JProfiler 7.0 introduces the following notable new features:
Probes. JProfiler now has a dedicated JEE & probes view section where you can record and analyze
high-level data from various subsystems. There are built-in probes for:
- JDBC
- JMS
- JNDI
- Servlets
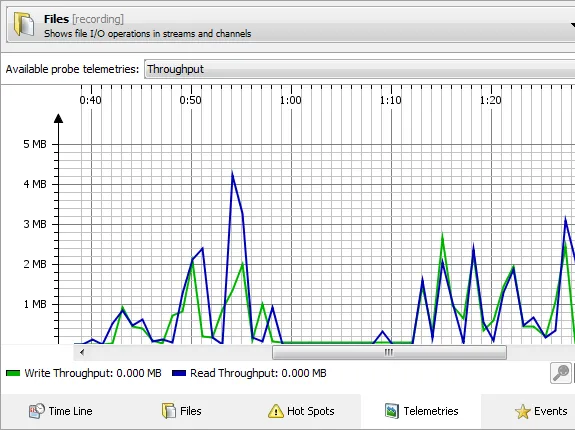
- Files
- Sockets
- Processes
Probes can have the following views:
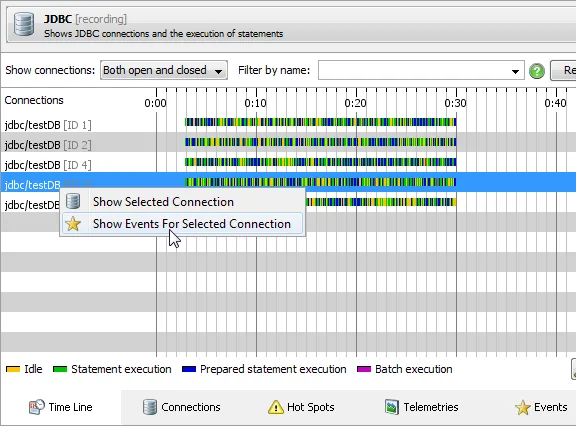
In the time line view, the probe shows its control objects as colored bars along a time axis.
Control objects are long-lived objects associated with single probe events. For example, in the JDBC
probe, the control objects are the database connections. The colors on the time line bars correspond to
the different states that the control object can be in.
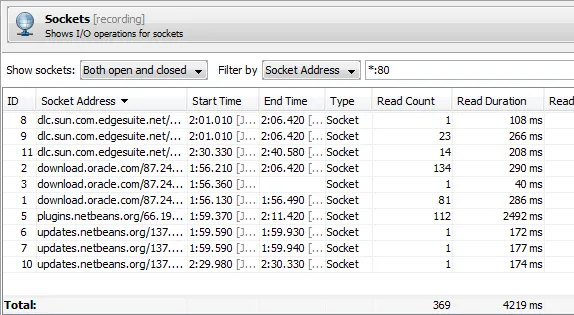
Tabular details about control objects are shown in the control objects view. It shows more details
about the control objects as well as statistics on the recorded events, such as total throughput for
file I/O. With the filter controls and the total line at the bottom you can make quick summations for
subsets of control objects.
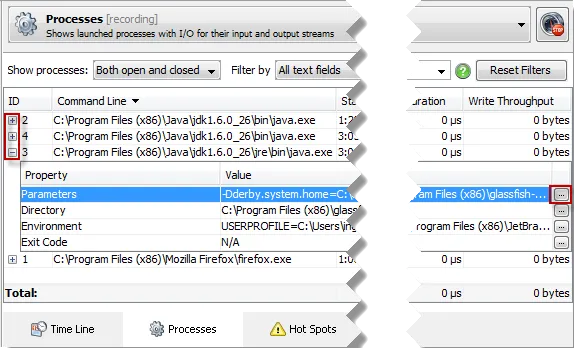
Some probes show additional detail in nested tables, where you can open a
dialog to show interesting multi-line values in more details. For example, the
command line parameters of a process can be very long.
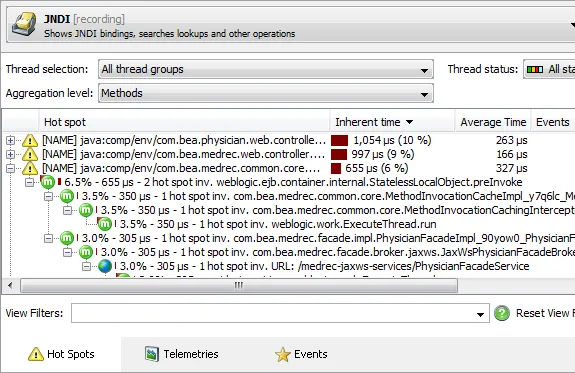
In the hot spots view, the probe shows hot spots of payload names published by probe events that are
sorted by execution time. For example, the file probe shows file names, the JDBC probe shows
SQL strings and the JNDI probe shows queries. Each hot spot can be expanded to show the back traces that
contribute to the hot spot.
In the telemetries view, you can see the various telemetries that are published by the probe.
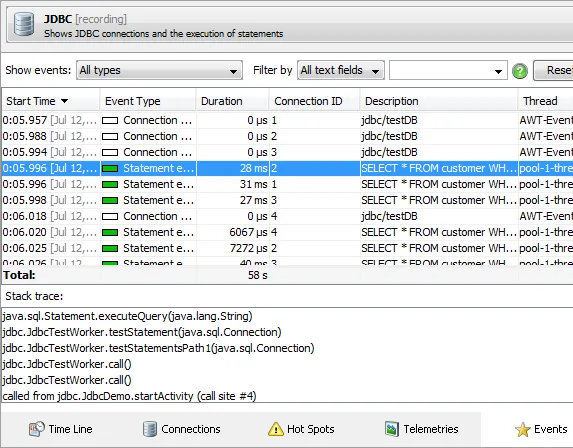
The events view shows the single events recorded by the probe. Events have thread and stack trace
information, and you can easily jump to the associated control object. Again, the filters and the total line
allow you to sum selected events.
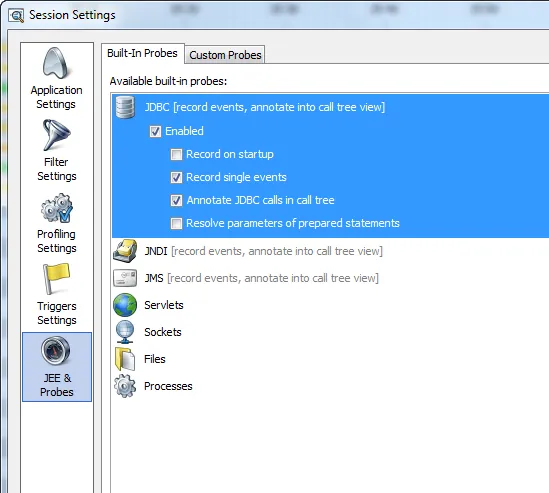
The built-in probes are configurable in the session settings:
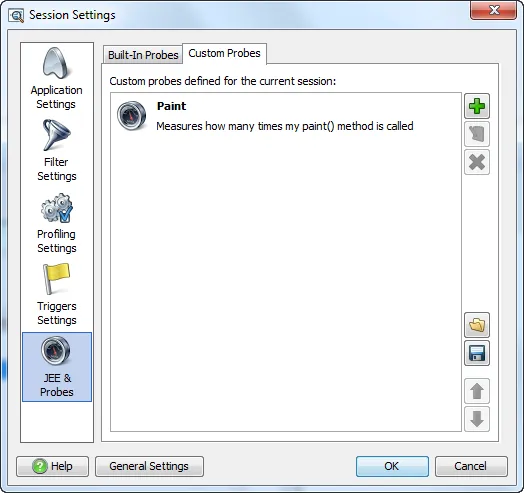
Apart from the built-in probes, you can define your own custom probes. JProfiler offers an API
for developing a custom probe in your IDE and deploying it together with the profiled application.
While this may be suitable for sophisticated custom probes that are used on a permanent basis, it is not a
viable way to quickly add some custom reporting in your day-to-day profiling. The edit-compile-deploy
cycle with an external API is just too clumsy to make it worth while for most situations.
That's why JProfiler offers a custom probe wizard that allows you to define your custom probes
directly in the JProfiler GUI. Your custom probes are deployed to the profiled application by JProfiler,
and you do not even have to restart the profiled application when changing or adding custom probes.
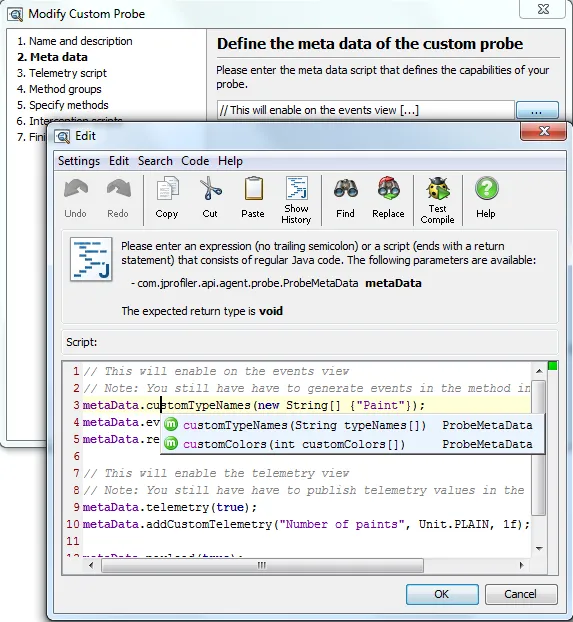
The custom probe wizard leads you step by step through the creation of a custom probe that can publish
telemetries and intercept methods. You configure the custom probe with a meta-data script which defines
all the capabilities of your probe. JProfiler has a code editor that offers code completion, context
sensitive Javadoc, and code analysis. This facility is also used by several other new features in this
release.
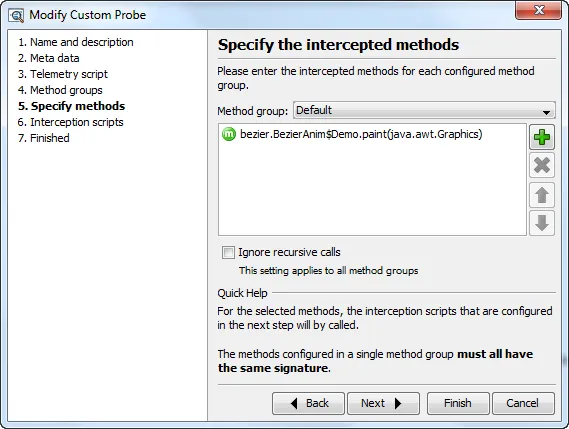
Intercepting methods is easy, you can select them from the class path or from the methods that have been
detected in the current profiling session.
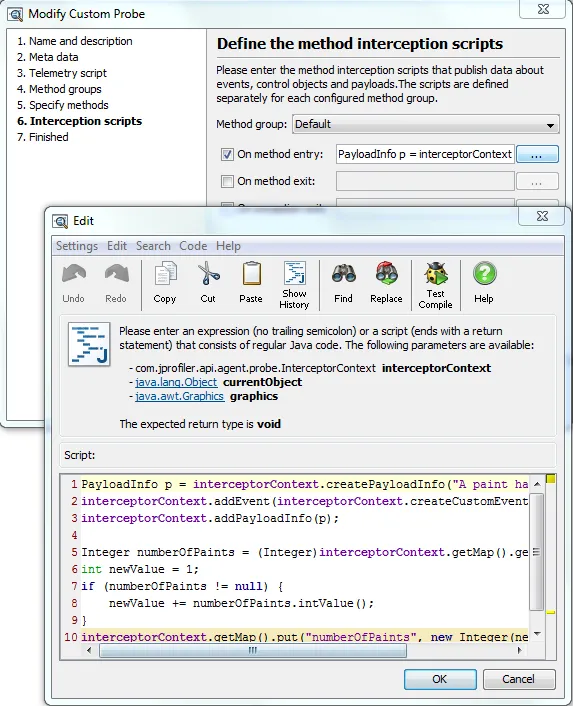
The main logic of most probes will be in the interception scripts that are called whenever one of the
selected methods is called in the profiled application.
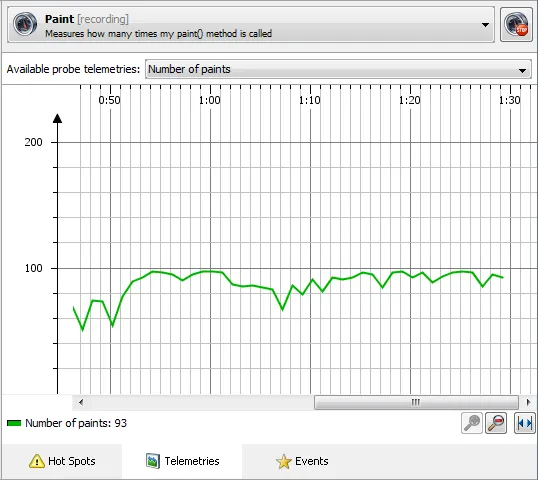
Custom probes are shown in the JEE & probes view section, just like the built-in probes.
The custom probe in this example does not publish control objects, so it just has the hot spots,
telemetries and events views.
With the innovative concept of request tracking, JProfiler makes profiling
of parallel and multi-threaded programming much easier. Request tracking connects call sites with
execution sites between different threads with hyperlinks in the call tree view. The following
multi-threaded systems can be tracked:
- Executors from the java.util.concurrent package
- AWT events
- SWT events
- Thread starts
For example, when you asynchronously submit a task to an executor, you might want to know how much time
was spent to complete the task:
One call site can have multiple execution sites. In the above example, repeated invocations were handled
by different threads in a thread pool. In that case, you can select the desired execution site after
clicking on the hyperlink:
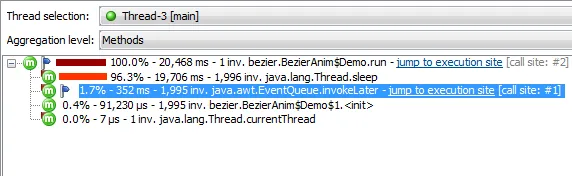
Each execution site is only called from a single call site. For example, if an executor pool thread is
handling tasks from different call sites, they are all shown separately. With a hyperlink, you
can jump back to the call site. This hyperlink is especially important in situations where you need to
find the origin of a long-running asynchronous task.
Request tracking can be enabled or disabled separately for each tracking type from the tool bar
or the session startup dialog.
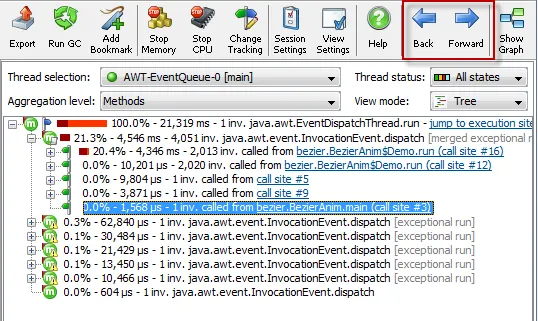
The call tree view now has a history. This is particularly useful for request tracking
where you typically jump back and forth between different threads and call stacks, but it works
for all manual changes of thread selection, thread status, aggregation level and tree view mode as well.
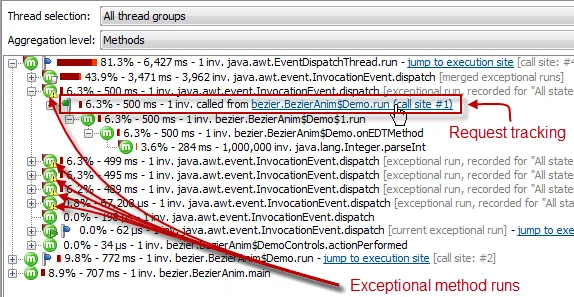
Analyzing long-running AWT tasks can now be done with a combination of an
exceptional method configuration for java.awt.InvocationEvent#dispatch()
and AWT request tracking. The exceptional method is added by default to new sessions,
and AWT request tracking can be switched on at any time.
The longest-running tasks can be studied in isolation, and you can jump directly to the call stack
in the thread that posted the event.
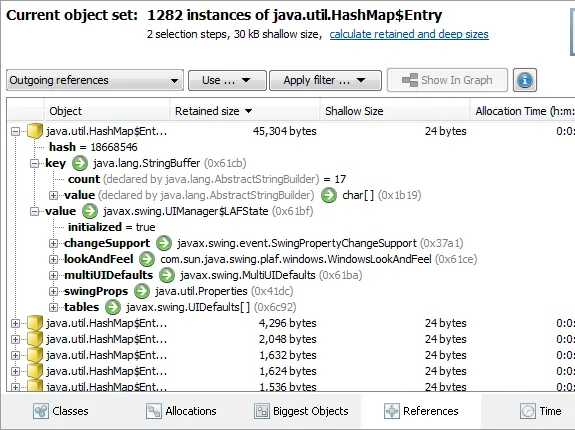
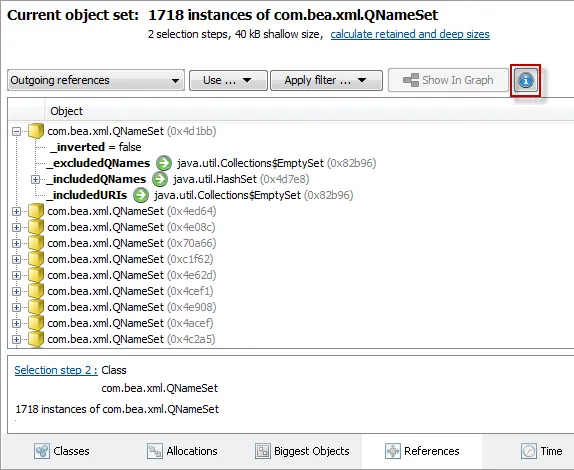
The references views in the heap walker have been redesigned. In the outgoing and incoming
references views you now see a list of objects, and the outgoing references directly show primitive data.
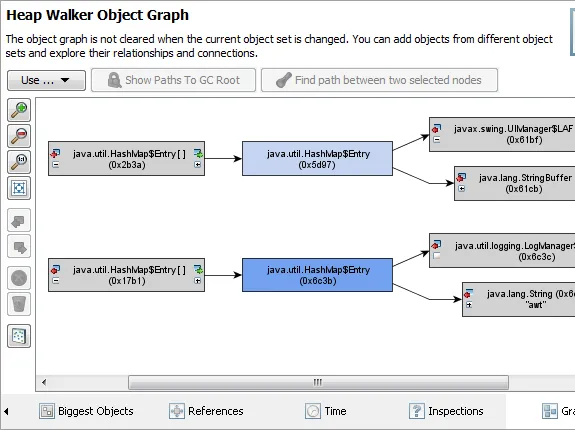
The graph in the heap walker is now a separate view which is independent of the current object set.
From the reference views, you can add objects to the graph, these objects are shown as blue nodes. The
darker its hue, the more recently it was added. Just like in the CPU call graph, you can now delete selected
objects and remove unconnected items.
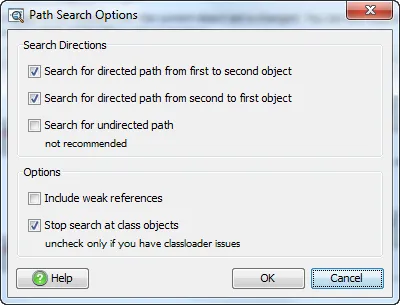
Apart from exploring the incoming and outgoing references and searching for paths to garbage collector roots,
you can now also search for paths between selected objects.
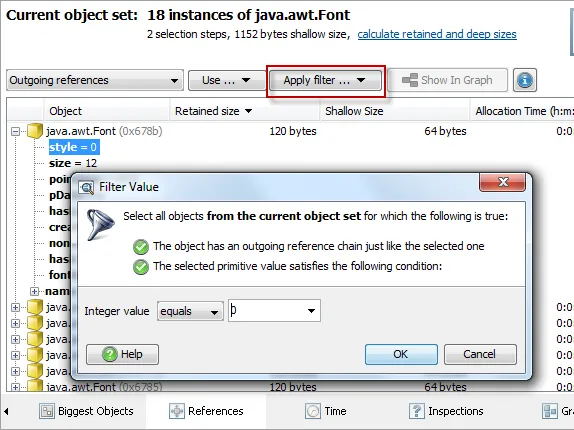
In the outgoing references view of the heap walker, you can now
apply filters. There are two different filter types. Firstly, you can
restrict a primitive value of a selected reference chain:
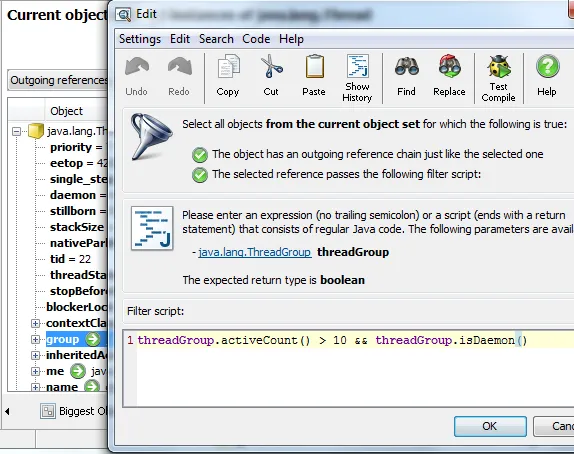
Secondly, for a live profiling session, you can also enter a filter script with an arbitrary expression to
decide whether an object should be accepted or not:
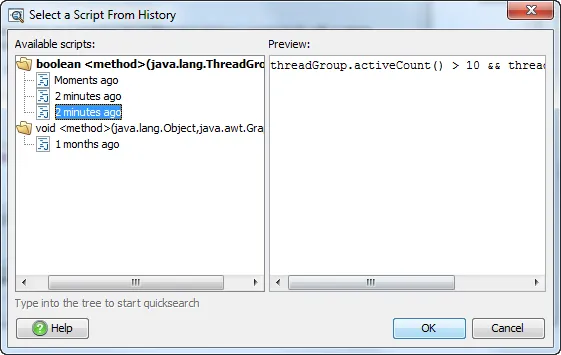
If you want to reuse expressions or scripts in different selection steps or in different sessions,
the script history dialog will show you your most recent input, grouped by method signature.
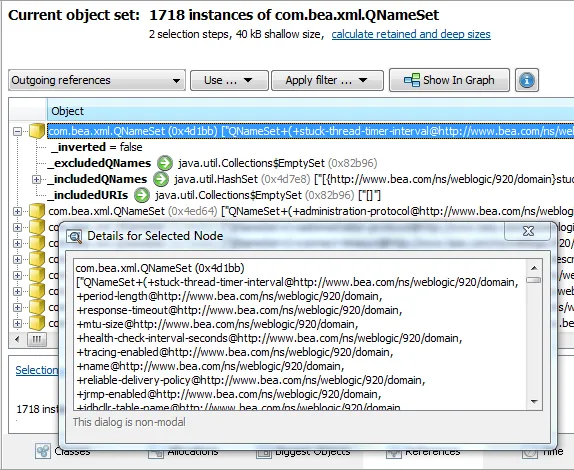
In the references view of the heap walker, you can now
evaluate and show the toString() values of all displayed objects. This only works for live sessions,
because for snapshots the objects are not on the heap anymore. This functionality is a great help
for finding familiar and relevant objects when searching for memory leaks.
After the toString() values have been evaluated, you can use the new "Show node details" action in the
context menu to inspect longer strings in a separate non-modal dialog that is updated as you change your
selection.
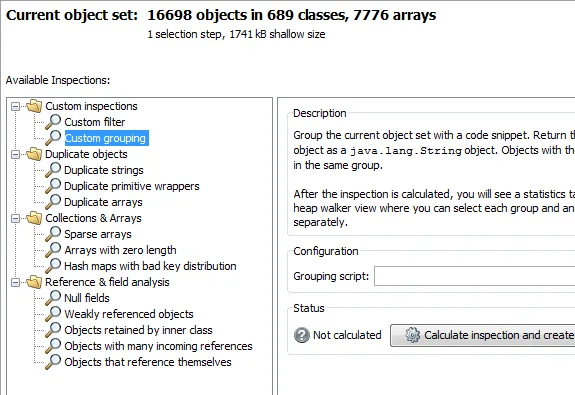
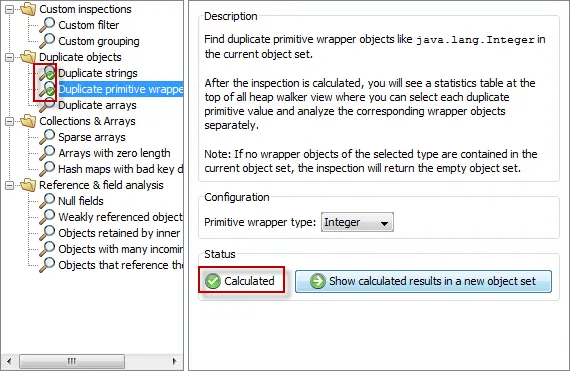
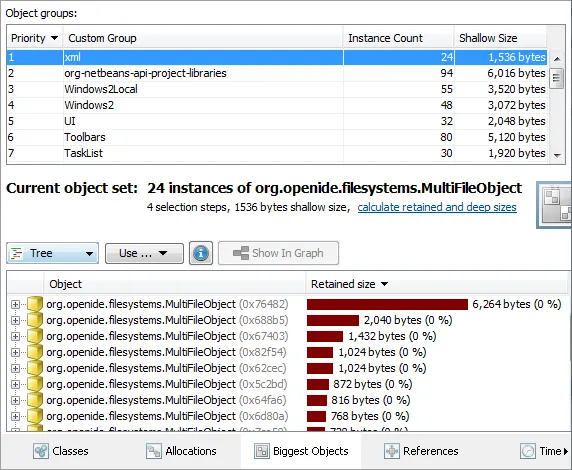
The heap walker has a new inspections view where you can run a number of inspections on the current
object set. The following inspections are supported:
- "Custom filter" to select objects with your own expression
- "Custom grouping", an extension of the custom filter with an additional group table (see below)
- "Duplicate strings" finds all strings that have the same characters
- "Duplicate primitive wrappers" finds all instances of a selected primitive wrapper type like java.lang.Integer that have the same primitive value
- "Duplicate arrays" finds all object arrays or primitive arrays with the same content
- "Sparse arrays" finds all object arrays that contain mostly null values
- "Arrays with zero length" finds all arrays that don't have any elements
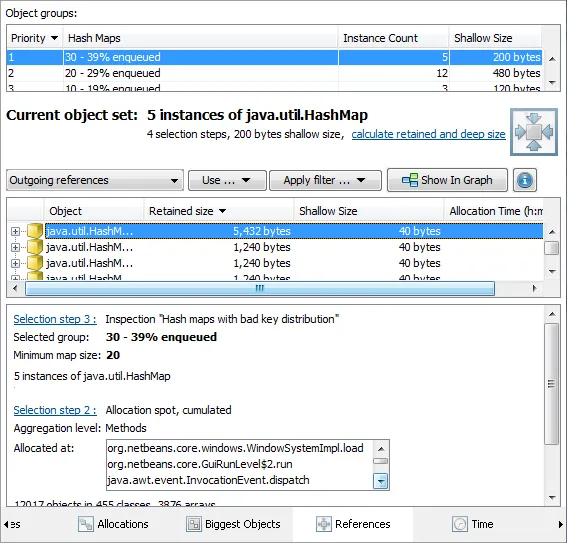
- "Hash map with bad key distribution" finds all hash maps whose keys do not have a good implementation of hashCode()
- "Weakly referenced objects" finds all objects that are referenced through weak, soft or phantom references
- "Objects retained by inner class" finds all objects that are not garbage collected because one of their inner classes holds on to them through a synthetic reference
- "Objects with many incoming references" finds objects that are referenced by the highest number of objects
- "Objects that reference themselves" find objects whose fields hold references to the same object
Inspection can take some time to calculate, so the results are cached, and you can quickly go back and forth between several
calculated inspections.
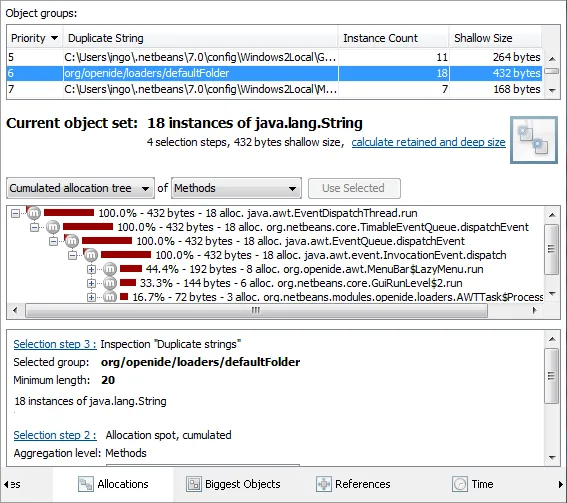
Most inspections add a group table at the top of the heap walker. The contents of the group
table are specific for each inspection. When you select any particular group, the corresponding object set
is shown immediately in the views below. For example, when searching for duplicate strings, you can
quickly explore the allocations spots of each duplicate string value.
Inspections in JProfiler are very flexible because they operate on the object set that you previously
defined through your selection steps. For example, finding hash maps with a bad key distribution is
not very useful if it is done for all hash maps in the JVM: A lot of the reported hash maps will be
in your application server or framework, and you will not be able to do anything about them.
With JProfiler you can first select one or more allocation spots or all hash maps that are retained by a
particular object, and then you can run the inspection:
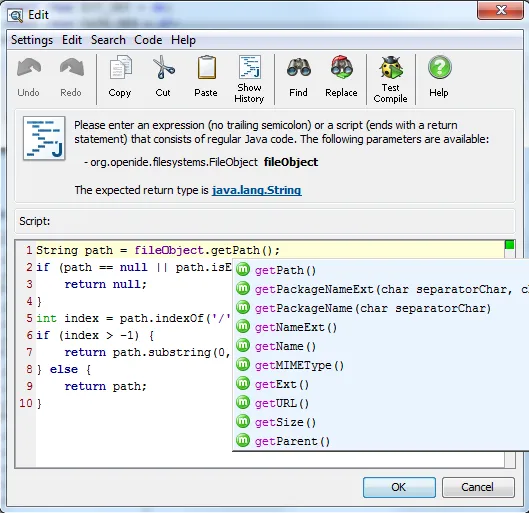
The custom group inspection is a great tool for analyzing objects in the heap with a granularity
that is finer than just the class name. The script editor gives you code completion for the
nearest public class. In the below example, this is the parent class of the actually selected objects.
The custom group inspection can do filtering and grouping at the same time.
The returned values of the inspection will be used as keys for the groups. As with
all inspections, you can use all views of the heap walker to further analyze the results and make
additional selection steps if necessary.
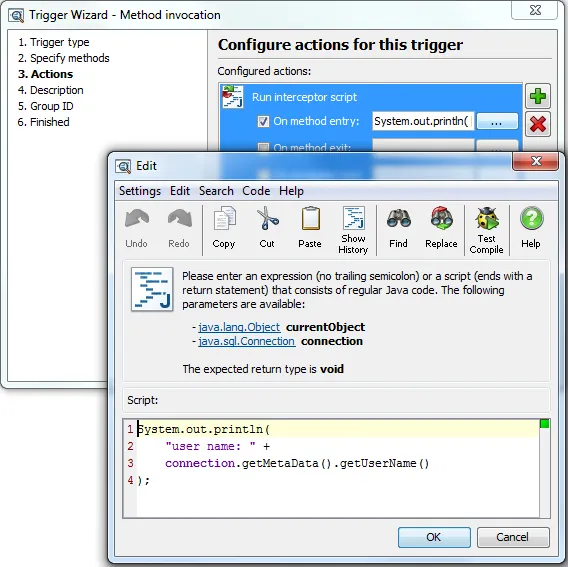
A run interceptor script trigger action has been added which uses the new script editor
facility. If you just want to execute some code when a particular method is called, this is easier
than using a custom probe. In the example below, the intercepted method gets a java.sql.Connection
parameter. In the editor, you get code completion for all parameters and the current object
if they can be found in the configured class path. For triggers that do not intercept methods,
a simple "Run script" trigger action has been added.